Source page: McKinsey & Company
Commentary
AI adjusts the software bill
Artificial Intelligence | Technology
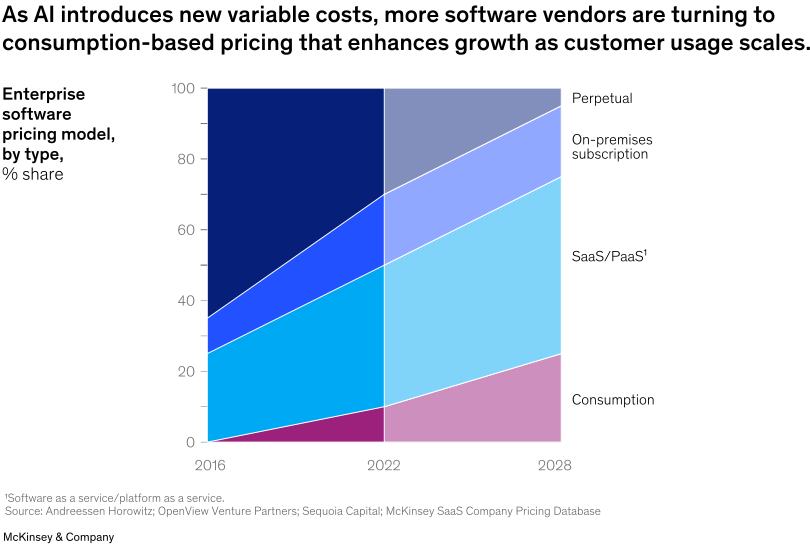
January 27, 2026 – As AI introduces new variable costs, the pricing models for enterprise software are evolving. Traditional models such as perpetual licenses (a one-time fee for the right to use software indefinitely) are declining in favor of software as a service (SaaS) and, increasingly, consumption-based pricing, explain McKinsey’s Jeremy Schneider, Joshan Abraham, Matt Linderman, Naveen Sastry, and coauthors. The number of software companies using consumption-based pricing more than doubled between 2015 and 2024. Software businesses that successfully adopt consumption-based pricing aligned with usage and outcomes may be better positioned to capture AI-driven value and differentiate themselves in a rapidly evolving market.
To read the article, see “The AI-centric imperative: Navigating the next software frontier,” October 16, 2025.
customizer here
Visual form
Stacked area chart.
Layout / body structure
The visual is a single chart centered on the page, with one continuous stack running from 2016 to 2028 and labels pulled to the right side at the end state. It reads left to right across time and then upward through the stacked pricing layers.
What is being compared
It compares four enterprise software pricing models over time: perpetual licensing, on-premises subscription, SaaS/PaaS, and consumption pricing. The chart is showing how the mix of pricing models changes rather than how one absolute market total changes.
Measurement system
The y-axis is percentage share from 0 to 100, so the full stack always represents the whole enterprise software pricing mix. The x-axis marks 2016, 2022, and 2028, and the right-side labels identify which colored band corresponds to each pricing model at the endpoint.
Visible structure inside the graphic
The chart is built from four stacked color bands whose boundaries slope over time, with a vertical divider at 2022 separating the earlier mix from the projected later mix. The right edge labels make the final ordering explicit, showing consumption at the bottom, SaaS/PaaS above it, then on-premises subscription, and perpetual at the top.
Main takeaway from the visual
The chart shows the software pricing mix shifting away from perpetual and fixed subscription models toward usage-linked revenue. Consumption starts as a negligible share in 2016, becomes visible by 2022, and expands sharply by 2028, while perpetual shrinks from the dominant top layer to a much smaller share.
Key standout values or extremes
Perpetual pricing falls from roughly two-thirds of the mix in 2016 to about one-fifth by 2028. Consumption rises from near zero in 2016 to roughly a quarter by 2028, while SaaS/PaaS expands to become the largest band in the final state at about half of the mix.
Controls / sequence, when applicable
This is a static chart image with no in-chart controls to operate.
Companion media, when applicable
There is no separate companion audio or video; the chart image is the full visual on this page.