Source page: McKinsey & Company
Commentary
Made in India for the EV age
Automotive | Electric vehicles | India
January 14, 2026 – Geopolitical and structural shifts are reshaping global trade, and the auto component industry has been heavily affected. India is increasingly well positioned in this realignment, supported by cost competitiveness, a skilled workforce, and a large domestic market, say McKinsey’s Brajesh Chhibber, Rajat Dhawan, Shivanshu Gupta, Shubham Singhal, and coauthors. Electrification and connectivity are accelerating this transition. Global electric-vehicle (EV) adoption is expected to rise sharply by 2030, with India’s EV sales projected to grow at about a 35 percent CAGR. As EVs gain traction, batteries, semiconductors, and other nontraditional components now account for 40 to 50 percent of an EV, while connected-car technologies are redefining mobility. India’s auto component sector is poised to be a critical node as automakers diversify supply chains and is projected to reach $200 billion by 2030.
To read the article, see “Shaping the future of India’s auto component industry amid global trade shifts,” November 12, 2025.
customizer here
Visual form
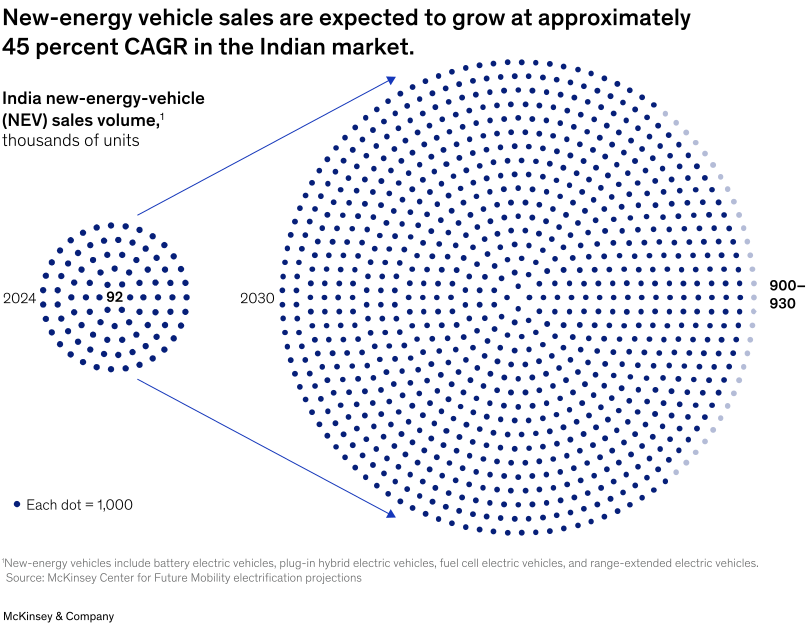
Single KPI / Metric: proportional unit-dot comparison of India’s new-energy-vehicle sales in 2024 and 2030.
Layout / body structure
The chart places a small 2024 dot field on the left and a much larger 2030 dot field on the right. Diagonal guide lines connect the two circles so the reader sees the market expanding from the current value to the forecast value.
What is being compared
It compares India’s new-energy-vehicle sales volume in 2024 with the projected sales volume in 2030. The comparison is a two-point scale change rather than a regional or segment breakdown.
Measurement system
The unit is thousands of vehicles, and each dot represents 1,000 units. The labels show 92 thousand vehicles in 2024 and roughly 900 thousand to 930 thousand vehicles in 2030.
Visible structure inside the graphic
The left circle contains a compact cluster of dots, while the right circle contains a much larger cluster with a lighter outer band. The size difference between the two dot fields is the main visual encoding.
Main takeaway from the visual
The chart shows India’s new-energy-vehicle market growing by nearly an order of magnitude by 2030. The dot fields make the increase feel like a scale jump, not a small forecast adjustment.
Key standout values or extremes
The chart moves from 92 thousand vehicles in 2024 to about 900 thousand to 930 thousand in 2030. That increase is labeled at approximately 45 percent compound annual growth.
Controls / sequence, when applicable
This is a static proportional unit-dot metric chart; there are no in-chart controls to operate.
Companion media, when applicable
There is no separate companion audio or video; the new-energy-vehicle unit-dot comparison is the full visual on this page.