Source page: McKinsey & Company
Commentary
China powers ahead in energy transition
China | Electric vehicles | Energy
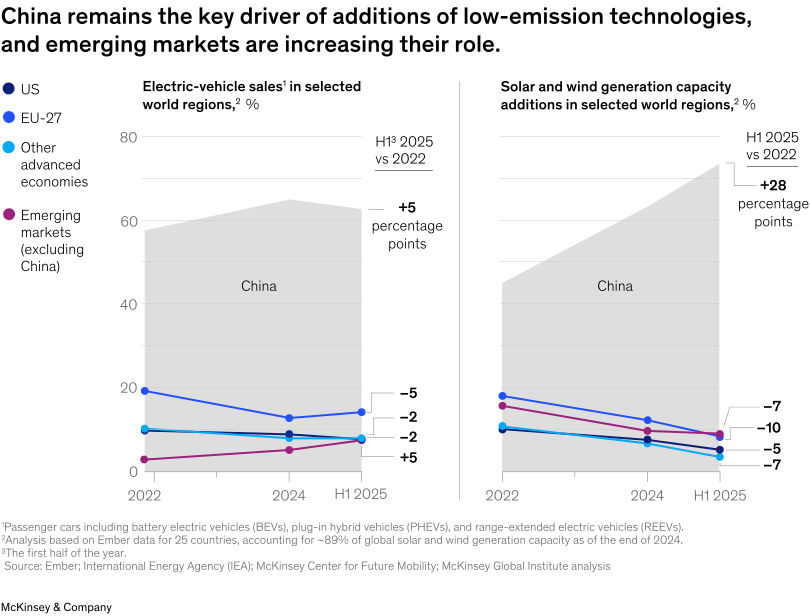
January 7, 2026 – The energy transition is advancing but unevenly. Only about 13.5 percent of the deployment needed to meet the goals of the 2015 Paris Agreement is in place, estimate McKinsey’s Chris Bradley, Humayun Tai, Mekala Krishnan, Sven Smit, and coauthors. Although multiple factors have spurred regional progress, the overall pace is roughly half of what the Paris Agreement requires. Deployment in some advanced economies is slowing, while emerging economies are accelerating. China leads this push, accounting for about two-thirds of recent deployment in fast-moving areas such as power and mobility.
To read the article, see “The hard stuff 2025: Taking stock of progress on the physical challenges of the energy transition,” November 6, 2025.
customizer here
Visual form
Two-panel line chart.
Layout / body structure
The chart is split into two side-by-side panels separated by a vertical divider. It reads left to right, first through electric-vehicle sales in selected world regions and then through solar and wind generation-capacity additions, with the same regional color key applied in both panels.
What is being compared
It compares regional shares of low-emission-technology additions across two domains: electric-vehicle sales and solar-and-wind capacity additions. In both panels, the comparison is between the US, the EU-27, other advanced economies, emerging markets excluding China, and China itself over the 2022 to H1 2025 period.
Measurement system
The unit is percentage share. The x-axis tracks 2022, 2024, and H1 2025, while the y-axis shows how much of total additions each region accounts for, so the main comparison is how the regional shares rise or fall over time in each technology area.
Visible structure inside the graphic
Each panel uses a large gray filled background area labeled China to show the dominant share, while the non-China regions are drawn as colored lines and point markers near the bottom of the chart. A right-side bracket in each panel lists the H1 2025 versus 2022 change in percentage points for every region, which turns the visual into both a trend chart and a net-change summary.
Main takeaway from the visual
The chart shows China remaining the dominant force in both EV sales and solar-and-wind additions, while emerging markets outside China become more important at the margin. The gray China area still occupies the majority of each panel in 2025, but the side annotations show that emerging markets are one of the few groups with positive share gains in both domains.
Key standout values or extremes
In EV sales, China gains 5 percentage points from 2022 to H1 2025 while the US loses 5 points and the EU-27 and other advanced economies each lose 2 points. In solar and wind, China gains 28 points, which is by far the largest shift in the figure, while the US loses 7 points, the EU-27 loses 10, other advanced economies lose 5, and emerging markets excluding China gain 7.
Controls / sequence, when applicable
This is a static chart image with no in-chart controls to operate.
Companion media, when applicable
There is no separate companion audio or video; the chart image is the full visual on this page.