Source page: McKinsey & Company
Commentary
Mining for resilience
Metals and mining | Decarbonization
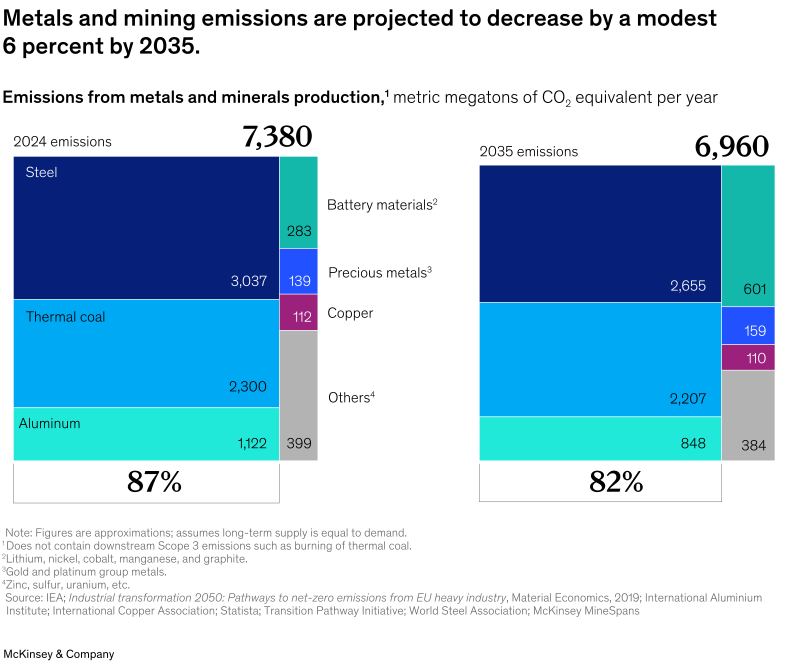
December 11, 2025 – Over the past year, the materials industry has undergone notable shifts, including rising resource nationalism, new demand from AI and defense, and a productivity rebound. The sector contracted in 2024, as metals and mining revenues fell 6 percent to about $3 trillion. Future success in metals and mining will require capturing growth, improving productivity, and delivering sustainable solutions, note Senior Partners Michel Van Hoey and Karel Eloot and coauthors. By 2035, demand growth could add about 620 megatons of CO₂ annually, largely counterbalanced by grid decarbonization, efficiency gains, and increased use of recycled materials. McKinsey projections estimate that these trends could yield a net emissions reduction by about 6 percent.
To read the report, see “Global Materials Perspective 2025,” October 7, 2025.
customizer here
Visual form
Two-panel treemap comparison.
Layout / body structure
The chart is split into two large stacked treemap-style blocks, with 2024 emissions on the left and 2035 emissions on the right. It reads left to right across the time comparison, with each panel partitioned into material categories whose rectangle size shows their contribution to the total.
What is being compared
It compares emissions from metals and minerals production between 2024 and 2035 and also compares the composition of those emissions across steel, thermal coal, aluminum, battery materials, precious metals, copper, and other materials. The chart is therefore showing both the total change and the change in mix.
Measurement system
The unit is metric megatons of CO2 equivalent per year. Each panel prints the total at the top, category values inside or beside the treemap blocks, and a large percentage at the bottom showing the share represented by the largest grouped materials.
Visible structure inside the graphic
Each side uses a large rectangular treemap broken into colored category bands and blocks. Steel dominates the upper left of both panels, thermal coal occupies a major lower-left block, and the smaller categories are stacked in a vertical strip on the right side, which makes the changing mix easy to compare between the two years.
Main takeaway from the visual
The chart shows only a modest decline in total emissions by 2035 rather than a dramatic decarbonization. The structure of the treemaps also shows that steel and thermal coal continue to dominate the emissions footprint, even as battery materials become a larger contributor in the 2035 mix.
Key standout values or extremes
Total emissions fall from 7,380 in 2024 to 6,960 in 2035, a decline of about 6 percent. Steel remains the largest block, dropping from 3,037 to 2,655, thermal coal declines from 2,300 to 2,207, and battery materials more than double from 283 to 601, making that category the clearest upward mover in the chart.
Controls / sequence, when applicable
This is a static chart image with no in-chart controls to operate.
Companion media, when applicable
There is no separate companion audio or video; the chart image is the full visual on this page.