Source page: McKinsey & Company
Commentary
Balancing the global books
Economy | Financial services
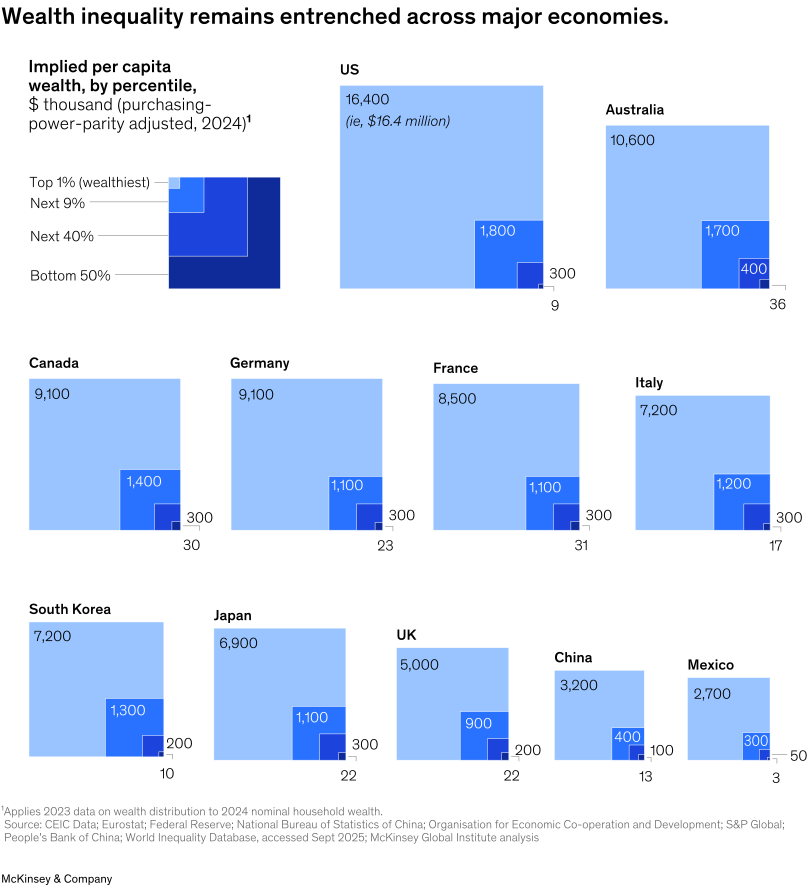
December 9, 2025 – Entering 2025, global wealth reached a record $600 trillion. However, much of this growth was driven by rising asset prices rather than new savings or investments. When assets outpace economic growth, inequality deepens. In 2024, the top 1 percent owned at least 20 percent of national wealth across major economies. In the United States, the top 1 percent owned 35 percent, or $16.5 million, while the bottom 50 percent held just $9,000, less than their counterparts in China in terms of purchasing power. Households without assets struggle to build wealth, note McKinsey’s Arvind Govindarajan, Ezra Greenberg, Jan Mischke, Michael Birshan, Olivia White, Rebecca J. Anderson, and Sven Smit. Their research introduces a “global balance sheet” to gauge whether policies can put economies on the ideal path of productivity acceleration, which could narrow global wealth and financial disparities.
To read the report, see “Out of balance: What’s next for growth, wealth, and debt?,” October 9, 2025.
customizer here
Visual form
Treemap: small-multiple wealth-distribution block charts by country and wealth-percentile group.
Layout / body structure
The page repeats the same block layout for each major economy. Within every country panel, the top 1 percent receives the dominant rectangle and the next 9 percent, next 40 percent, and bottom 50 percent appear as smaller adjacent blocks.
What is being compared
It compares per capita wealth across four percentile groups within each country, then lets the reader compare those percentile gaps across the United States, Australia, Canada, Germany, Italy, Mexico, Spain, Japan, France, the United Kingdom, and China.
Measurement system
The values are thousands of dollars in purchasing-power-parity-adjusted 2024 terms. Rectangle area and direct numeric labels carry the magnitude for each wealth group.
Visible structure inside the graphic
The largest pale block in each panel represents the top 1 percent, while the darker lower-percentile blocks are compressed into much smaller spaces. Repeating the same geometry across countries makes both national wealth levels and within-country concentration visible.
Main takeaway from the visual
The chart shows that wealth concentration is the common pattern across the displayed economies. The size gap between the top 1 percent and the bottom half remains stark in every country panel.
Key standout values or extremes
The United States has the largest top-1-percent value at 16,400, followed by Australia at 10,600 and Canada and Germany at 9,100. Bottom-50-percent values are far smaller, including 9 in the United States, 36 in Australia, 30 in Canada, and 3 in Mexico.
Controls / sequence, when applicable
This is a fixed small-multiple treemap; there are no in-chart controls to operate.
Companion media, when applicable
There is no separate companion audio or video; the wealth-distribution treemap is the visual on this page.