Source page: McKinsey & Company
Commentary
Future fuels and forces
Energy | Renewable energy | Sustainability
November 25, 2025 – Geopolitics, policy changes, and rising energy demand are transforming the global energy landscape. McKinsey’s tenth Global Energy Perspective analyzes how long-term structural forces and short-term realities could shape this transition, outlining three possible pathways: Slow Evolution, Continued Momentum, and Sustainable Transformation. Across all these scenarios, power demand is expected to rise, note Senior Partner Humayun Tai and coauthors. Renewables and gas are expected to dominate new power supply in 2050. Clean, firm power—such as nuclear, geothermal, and hydropower—and storage technologies like batteries and pumped hydro are set to expand.
To read the report, see “Global Energy Perspective 2025,” October 13, 2025.
customizer here
Visual form
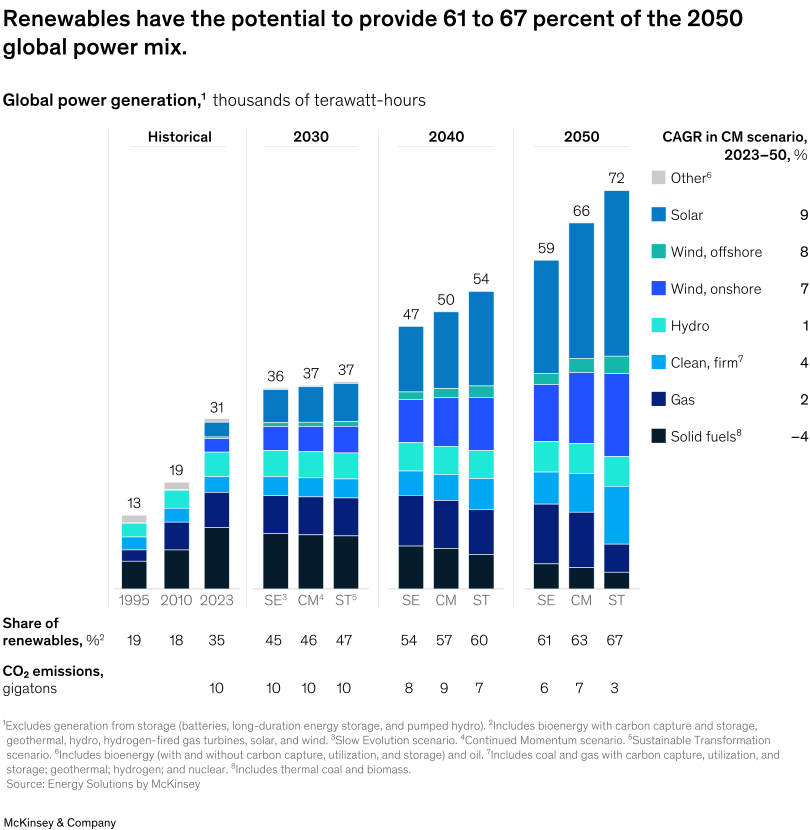
Stacked bar chart sequence showing the power-generation mix across historical and future scenario columns.
Layout / body structure
The graphic reads left to right from historical bars into 2030, 2040, and 2050 scenario groups, with a legend and CAGR list on the right and two summary rows beneath the bars for renewable share and CO2 emissions.
What is being compared
It compares global power generation by energy source across historical years and three forward scenarios, showing how solar, wind, hydro, clean firm power, gas, solid fuels, and other sources change in the total mix over time.
Measurement system
The main stacks are measured in thousands of terawatt-hours, the bottom summary row reports the share of renewables in percent, the next row reports CO2 emissions in gigatons, and the right-side column gives CAGR percentages for the 2023 to 2050 continued-momentum scenario.
Visible structure inside the graphic
Each column is a vertical stack of colored source segments, grouped under Historical, 2030, 2040, and 2050 headings. The totals are printed above the bars, the renewable-share and emissions rows run directly below them, and the legend on the right names every color band and its growth rate.
Main takeaway from the visual
The stacks become much taller and much cleaner over time, with renewables taking a majority share of the mix by 2040 and an even larger share by 2050 while solid fuels shrink sharply.
Key standout values or extremes
The chart shows total generation rising from 13 in 1995 to 72 in the 2050 sustainable-transformation case, renewable share moving from 35 percent in 2023 to 61 to 67 percent by 2050, CO2 emissions falling from 10 gigatons in 2023 to as low as 3, and the fastest listed CAGR belonging to solar at 9 percent.
Controls / sequence, when applicable
This is a static chart image with no in-chart controls to operate.
Companion media, when applicable
There is no separate companion audio or video; the chart image is the full visual on this page.