Source page: McKinsey & Company
Commentary
Revving up Europe’s automotive edge
Automotive | Europe
November 19, 2025 – The European automotive industry, a key economic pillar for the region, faces significant challenges from technological disruptions, international competition, geopolitical issues, and high costs. To future-proof the value chain, the ecosystem could be strengthened by developing a strong EU battery value chain. Europe produces less than 10 percent of global battery cell capacity and even less in upstream activities, leaving OEMs dependent on imports, Senior Partner Andreas Tschiesner and coauthors note. By 2030, battery demand for electric vehicles could reach 600–800 gigawatt-hours—three to four times today’s capacity—amid a mismatch between Europe’s focus on nickel manganese cobalt (NMC) technologies and market demand for lithium iron phosphate (LFP) batteries, largely reliant on China.
To read the article, see “A new ‘ERA’: An action plan for the European automotive industry,” September 8, 2025.
customizer here
Visual form
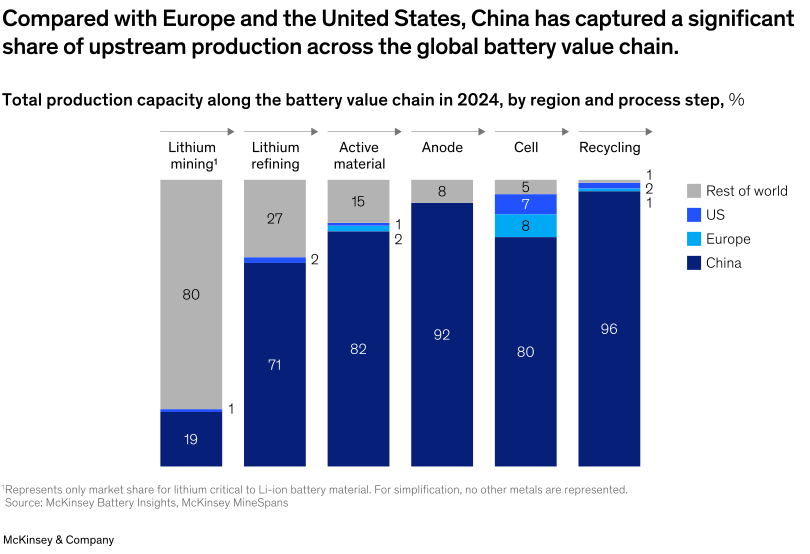
Stacked bar chart sequence across battery-value-chain process steps.
Layout / body structure
The page presents six vertical stacked columns arranged left to right by process step, from lithium mining through recycling, with directional arrows across the top to show the flow of the value chain and a color legend on the right.
What is being compared
It compares regional shares of total production capacity in 2024 across the battery value chain, separating China, Europe, the United States, and the rest of the world for lithium mining, lithium refining, active material, anode, cell, and recycling.
Measurement system
Each column is measured in percent of total production capacity. The segment labels inside the stacks show the regional share at each process step, and the legend ties each color to one geography so the reader can compare regional control from one stage to the next.
Visible structure inside the graphic
Every process step is a single vertical stack split into four regional segments. China is shown in dark navy at the base of most columns, Europe in cyan, the United States in bright blue, and the rest of the world in gray at the top. The arrows above the columns reinforce the left-to-right production flow.
Main takeaway from the visual
China dominates most upstream battery production steps, while Europe and the United States hold only small shares in most columns and the biggest non-China position appears in lithium mining, where the rest of the world remains the clear leader.
Key standout values or extremes
The most concentrated columns are recycling at 96 percent China, anode at 92 percent China, active material at 82 percent China, and cells at 80 percent China. The clearest exception is lithium mining, where the rest of the world holds 80 percent and China holds 19 percent, while Europe reaches 8 percent and the United States 7 percent only in the cell step.
Controls / sequence, when applicable
This is a static chart image with no in-chart controls to operate.
Companion media, when applicable
There is no separate companion audio or video; the chart image is the full visual on this page.