Source page: McKinsey & Company
Commentary
Following payments' paths
Financial services | Payments
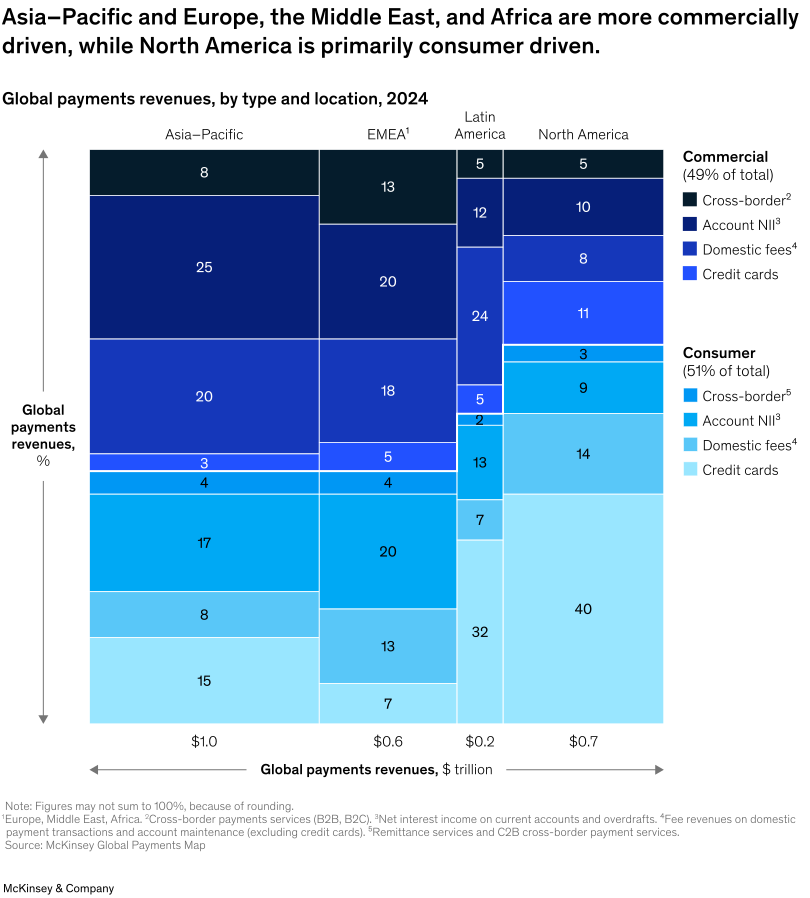
November 18, 2025 – The global payments industry is a valuable segment of the financial-services sector, generating $2.5 trillion in revenue, supported by 3.6 trillion transactions. And how money moves is becoming as critical as how much, Partner Uzayr Jeenah and coauthors explain. Payments revenue pools differ in their consumer-versus-commercial orientation depending on regional preferences. In Asia–Pacific, a quarter of revenues comes from commercial account net interest income (NII), while consumer activity—largely due to the widespread use of credit cards as the main payment and lending method—is the main driver in North America. Europe, the Middle East, and Africa have a more diverse mix of revenues, including 20 percent from commercial account NII and 20 percent from consumer account NII.
To read the report, see “The 2025 McKinsey Global Payments Report: Competing systems, contested outcomes,” September 26, 2025.
customizer here
Visual form
Stacked Bar / Stacked Column: variable-width stacked-column chart of 2024 payments revenue by region and payment type.
Layout / body structure
Four regional columns run left to right: Asia-Pacific, EMEA, Latin America, and North America. Each column is divided into commercial revenue blocks above the midline and consumer revenue blocks below it, with category colors explained in the legend at right.
What is being compared
It compares regional payments revenue by total market size, commercial-versus-consumer mix, and underlying revenue category, including cross-border payments, account net interest income, domestic fees, and credit cards.
Measurement system
Column width represents total regional revenue in dollars, while the stacked percentages inside each column show the revenue mix. The bottom labels show $1.0 trillion for Asia-Pacific, $0.6 trillion for EMEA, $0.2 trillion for Latin America, and $0.7 trillion for North America.
Visible structure inside the graphic
Wider columns signal larger regional markets, and the stacked blocks inside each column show how revenue is distributed. Darker blues sit in the commercial half, lighter blues sit in the consumer half, and the center split makes the 49 percent commercial versus 51 percent consumer total visible.
Main takeaway from the visual
The chart shows that the same payments market is built differently by region. Asia-Pacific and EMEA are more commercially driven, while North America is much more consumer weighted and especially exposed to credit-card revenue.
Key standout values or extremes
North America has the largest consumer-credit-card share at 40 percent. Asia-Pacific shows 25 percent commercial account net interest income and 20 percent commercial domestic fees, while EMEA shows 20 percent commercial account net interest income and 13 percent commercial cross-border revenue.
Controls / sequence, when applicable
This is a fixed variable-width stacked-column chart; there are no in-chart controls to operate.
Companion media, when applicable
There is no separate companion audio or video; the payments-revenue stacked-column chart is the visual on this page.