Source page: McKinsey & Company
Commentary
FDI fuels chip shift
Global Trade | Semiconductors
November 13, 2025 – The global economy’s future will be powered by leading-edge semiconductors. As geopolitical tensions rise, countries and companies are moving to diversify production beyond Taiwan and South Korea and bring manufacturing closer to home. In this context, foreign direct investment (FDI) is emerging as a key driver of global capacity growth. In fact, FDI could bolster the United States’ capacity, potentially making it the second-largest producer of leading-edge semiconductors by the early 2030s, Senior Partner Olivia White and colleagues note. However, the reliance on global supply chains for raw materials and manufacturing equipment remains a critical factor in the industry’s future stability.
To read the report, see “The FDI shake-up: How foreign direct investment today may shape industry and trade tomorrow,” September 22, 2025.
customizer here
Visual form
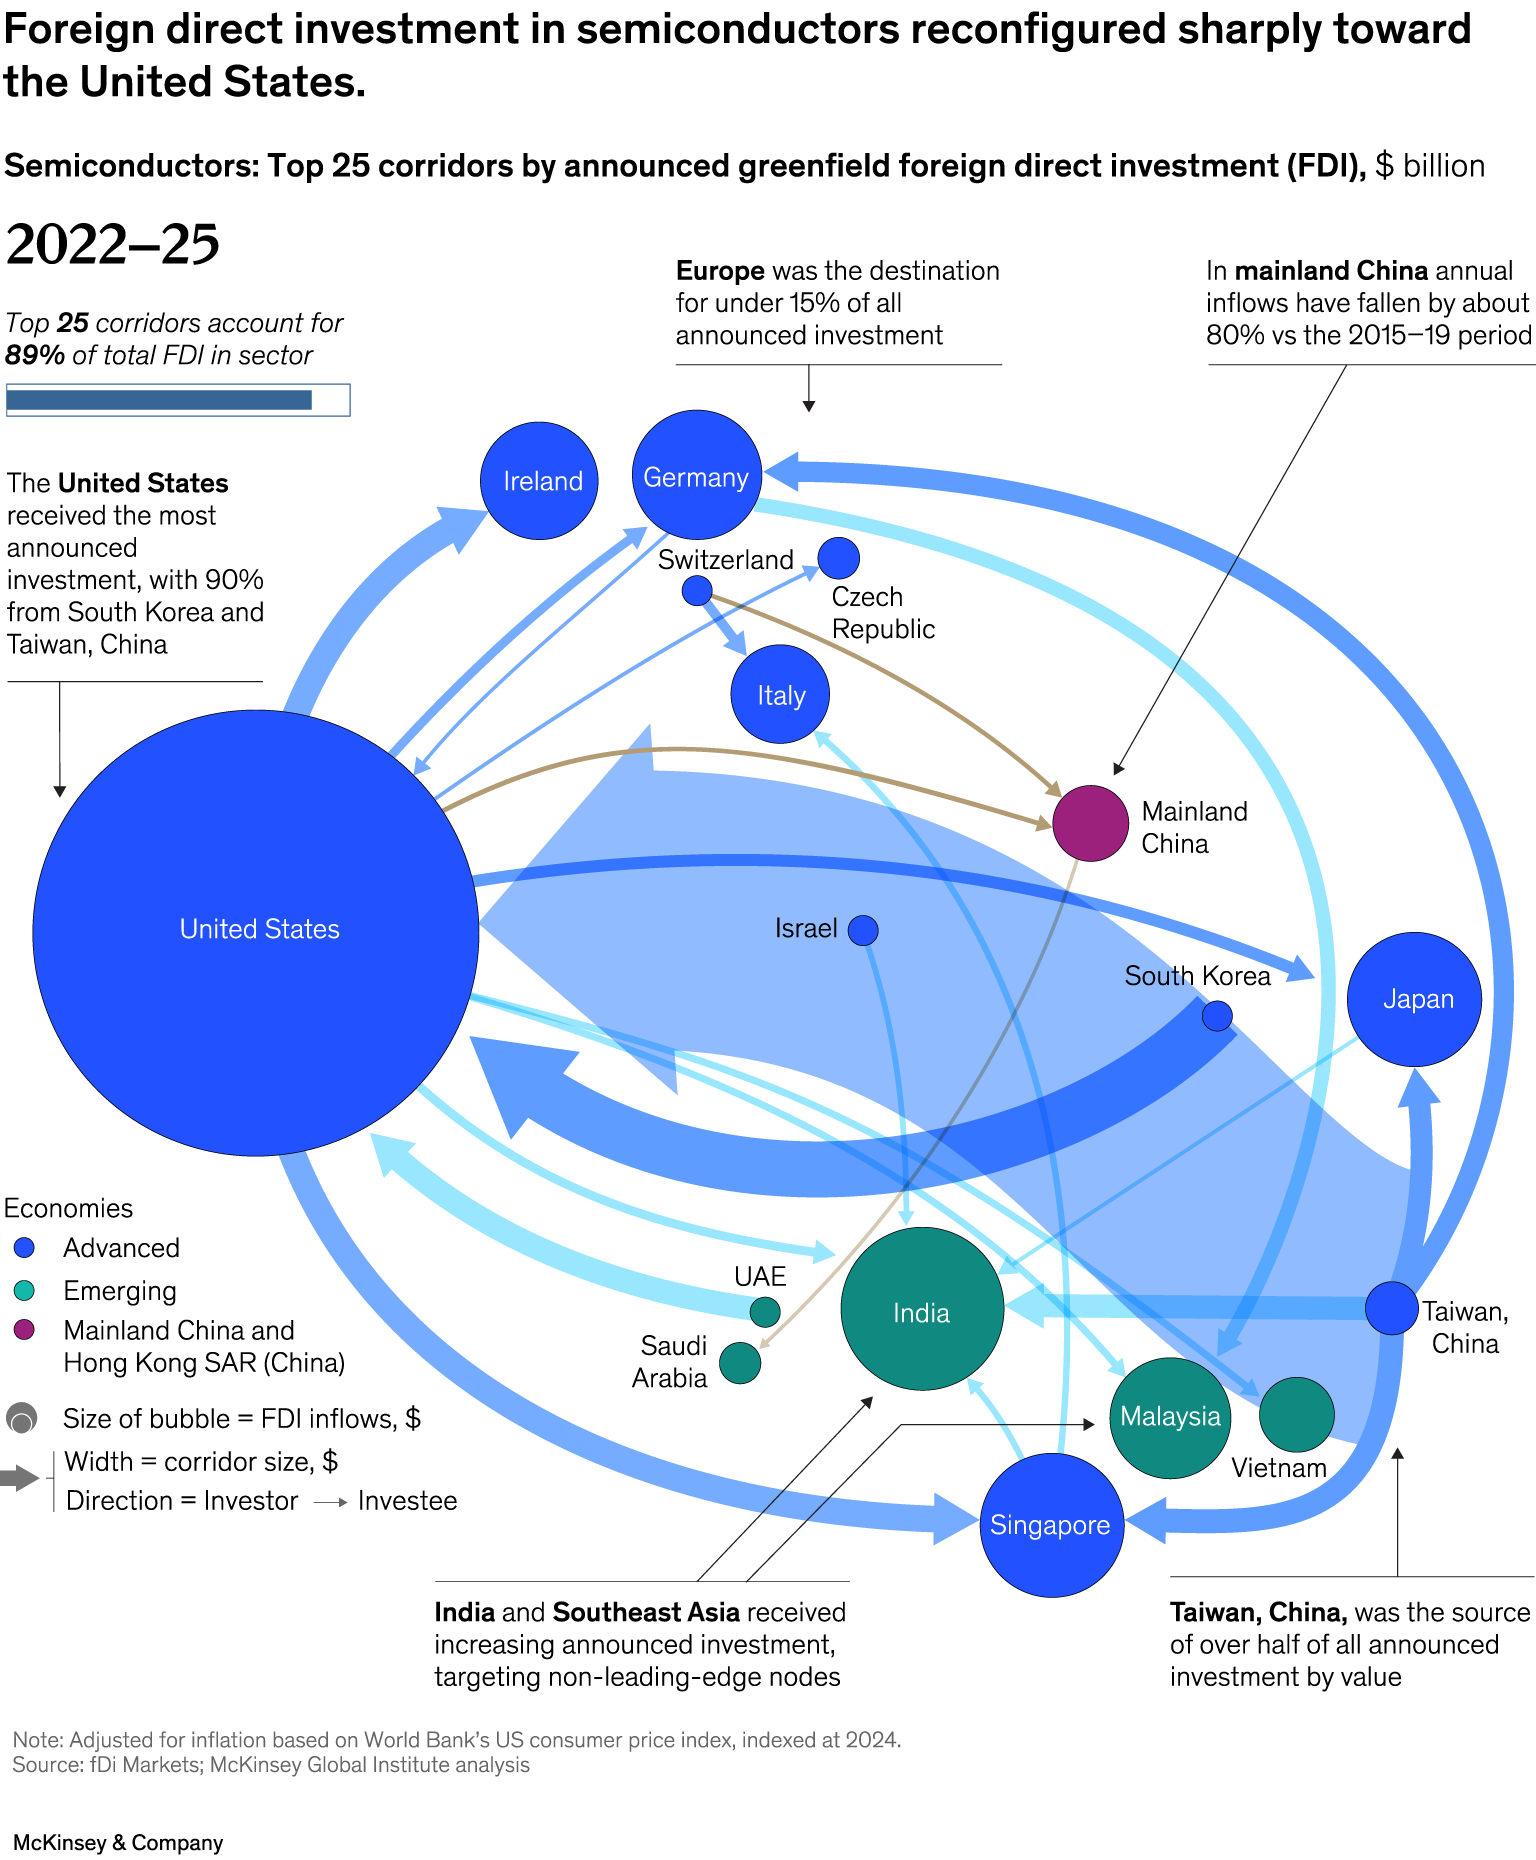
Bubble-and-flow network map showing semiconductor foreign direct investment corridors.
Layout / body structure
The visual is a single network diagram centered on bubbles for the key economies, with directional flows curving between them. It reads across the whole page as a map of corridors rather than left to right, with explanatory callouts placed around the edges and the legend in the lower left.
What is being compared
It compares the top 25 announced greenfield FDI corridors in semiconductors from 2022 to 2025, showing which economies are the main sources of investment and which economies are the main destinations.
Measurement system
The units are billions of dollars. Bubble size represents FDI inflows, line width represents corridor size, arrow direction shows investor-to-investee flow, and color distinguishes advanced economies, emerging economies, and mainland China and Hong Kong SAR (China).
Visible structure inside the graphic
The largest bubble belongs to the United States, with smaller advanced-economy nodes across Europe and East Asia and emerging-economy nodes across India, Malaysia, Vietnam, Saudi Arabia, and the UAE. Thick curved arrows connect the biggest corridors, while the annotation boxes call out the major geographic shifts.
Main takeaway from the visual
The network shows a sharp reorientation toward the United States as the main destination for semiconductor FDI, alongside a weakening position for mainland China and a rising role for India and Southeast Asia in the flow map.
Key standout values or extremes
The graphic states that the top 25 corridors account for 89 percent of total FDI in the sector. The United States received the most announced investment, with 90 percent coming from South Korea and Taiwan, China; Europe captured under 15 percent of all announced investment; mainland China annual inflows fell by about 80 percent versus 2015 to 2019; and Taiwan, China, was the source of over half of all announced investment by value.
Controls / sequence, when applicable
This is a static chart image with no in-chart controls to operate.
Companion media, when applicable
There is no separate companion audio or video; the chart image is the full visual on this page.