Source page: McKinsey & Company
Commentary
Investing in bridges to bandwidth
Infrastructure
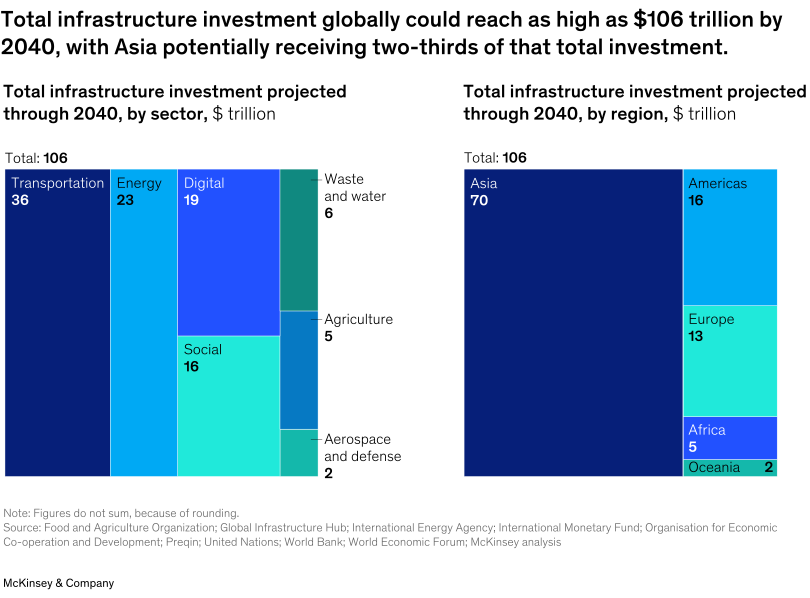
November 12, 2025 – Infrastructure underpins global prosperity and modern industry. A confluence of global forces is accelerating the need for infrastructure investment and is changing the very definition of infrastructure, note Senior Partner Ishaan Nangia and coauthors. Traditional structures like roads and power grids now coexist with digital infrastructure such as fiber networks, data centers, and electric-vehicle charging stations—each requiring major, long-term investment. McKinsey projects that $106 trillion in global infrastructure investment will be needed through 2040, spanning seven sectors, led by transportation ($36 trillion), energy ($23 trillion), and digital ($19 trillion). Asia will likely account for two-thirds of the total need due to urban and industrial growth.
To read the report, see “The infrastructure moment,” September 9, 2025.
customizer here
Visual form
Two-panel treemap comparison, with one treemap by sector and one treemap by region.
Layout / body structure
The page is split into two side-by-side treemaps that read left to right. The left treemap breaks the projected total by sector, and the right treemap breaks the same total by region, with notes and sourcing running underneath both panels.
What is being compared
It compares projected total infrastructure investment through 2040 by sector on the left and by region on the right, using the same global total in both panels.
Measurement system
All values are measured in trillions of dollars. The area of each rectangle reflects its share of the total, and the numeric labels printed inside or beside the blocks show the projected amount for each sector or region.
Visible structure inside the graphic
The left treemap contains large labeled rectangles for transportation, energy, digital, and social infrastructure, with smaller stacked blocks for waste and water, agriculture, and aerospace and defense. The right treemap is dominated by a very large Asia block, with smaller rectangles for the Americas, Europe, Africa, and Oceania.
Main takeaway from the visual
The side-by-side treemaps show that transportation is the largest sectoral investment need and that Asia overwhelmingly dominates the regional distribution of projected infrastructure spending.
Key standout values or extremes
The total shown at the top of both panels is $106 trillion. On the sector side, transportation is the largest block at 36, followed by energy at 23 and digital at 19. On the regional side, Asia is by far the largest block at 70, versus 16 for the Americas, 13 for Europe, 5 for Africa, and 2 for Oceania.
Controls / sequence, when applicable
This is a static chart image with no in-chart controls to operate.
Companion media, when applicable
There is no separate companion audio or video; the chart image is the full visual on this page.