Source page: McKinsey & Company
Commentary
Made and taught in America
Education | Manufacturing | Productivity
November 5, 2025 – This week, our charts focus on productivity—from achieving successful transformations to advanced-manufacturing projects and more.
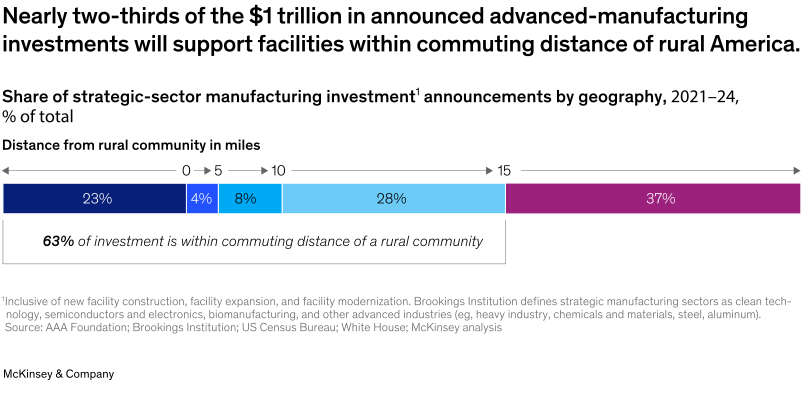
Roughly 63 percent of the $1 trillion in announced advanced-manufacturing investments—spanning clean technology, semiconductors, and biomanufacturing—will be located within commuting distance of rural America, compared with just 30 percent of current manufacturing jobs. This geographic shift could spark major productivity gains by connecting rural workers to tech-driven careers and, with stronger local K–12 education, could help fill the 2.1 million-worker gap that’s projected by 2030, note Senior Partner Nora Gardner and coauthors. Companies that hire and train locally can boost retention and efficiency, contributing to an estimated $20 billion from improved productivity and $34 billion in additional annual wages for rural communities.
To read the article, see “Manufacturing in rural America: A plan for K–12–industry partnerships,” August 5, 2025.
customizer here
Visual form
Segmented horizontal bar chart showing manufacturing-investment share by distance from rural communities.
Layout / body structure
The graphic is built around a single horizontal stacked bar, with distance break markers and arrows running above it and a boxed callout underneath it. The reading order is top to bottom: the distance scale first, the segmented share bar second, and the rural-commuting callout third.
What is being compared
It compares the share of strategic-sector manufacturing investment announcements from 2021 to 2024 across distance bands measured from rural communities, separating the total by how close planned facilities are to rural America.
Measurement system
The values are percentages of total announced investment. The band labels are printed directly inside the colored bar segments, and the markers above the bar show the distance thresholds in miles.
Visible structure inside the graphic
The chart uses five colored horizontal segments labeled 23 percent, 4 percent, 8 percent, 28 percent, and 37 percent. Above the bar, arrow markers indicate the distance thresholds, and below the bar a boxed note summarizes the combined share that falls within commuting distance.
Main takeaway from the visual
Most of the announced investment sits close enough to rural America to be reachable by commuting distance rather than being concentrated only in faraway urban locations.
Key standout values or extremes
The largest single segment is the 37 percent block at the farthest distance band, but the chart’s central summary is that 63 percent of investment falls within commuting distance of a rural community. The full headline frames the total announced advanced-manufacturing investment base at about $1 trillion.
Controls / sequence, when applicable
This is a static chart image with no in-chart controls to operate.
Companion media, when applicable
There is no separate companion audio or video; the chart image is the full visual on this page.