Source page: McKinsey & Company
Commentary
Global gains surge
Economy
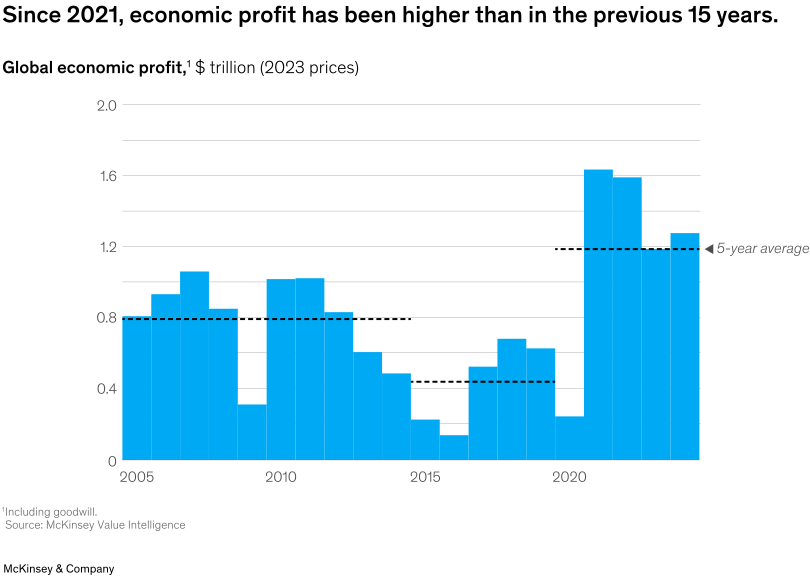
October 28, 2025 – Global economic profit (EP) pools have rebounded over the past four years, McKinsey’s analysis of the 4,000 largest nonfinancial companies (by market capitalization) since 2005 shows. Adjusted for inflation, EP between 2020 and 2024 reached about $1.2 trillion annually—50 percent higher than 2005–09 levels. Having recovered from a financial crisis, a global pandemic, and other macroeconomic shocks, EP has reached new highs, note Senior Partner Marc de Jong and coauthor. Whether this rebound endures will hinge on the continued outperformance of the Magnificent Seven tech companies and capital growth and profitability across Europe, mainland China, and North America.
To read the article, see “Global economic profit bounces back to an all-time high,” September 4, 2025.
customizer here
Visual form
Time-series bar chart with segmented five-year-average reference lines.
Layout / body structure
The graphic is a single chart that reads left to right across annual bars from the mid-2000s into the mid-2020s. Three horizontal dashed reference lines sit across different time spans, marking the average level for each five-year block, and the source notes run underneath the plot.
What is being compared
It compares annual global economic profit over time and shows how the recent period sits against earlier multi-year averages.
Measurement system
The vertical axis is measured in trillions of dollars at 2023 prices, while the horizontal axis tracks calendar years. The dashed lines mark five-year average levels so the reader can compare recent bars against earlier baseline periods.
Visible structure inside the graphic
The chart uses one run of vertical blue bars, with heights rising and falling across the full series. A dashed average line sits around 0.8 for the first block, another much lower dashed line sits around the middle trough years, and a higher dashed line near 1.2 appears over the most recent block.
Main takeaway from the visual
The most recent bars sit well above the earlier average bands, so the chart shows a clear step-up in global economic profit since 2021 rather than a continuation of the earlier range.
Key standout values or extremes
The highest bar is a little above 1.6 trillion in the early 2020s, another nearby bar is just under that level, and the most recent value is still above the latest five-year average near 1.2 trillion. By contrast, the mid-2010s trough drops close to 0.1 to 0.2 trillion.
Controls / sequence, when applicable
This is a static chart image with no in-chart controls to operate.
Companion media, when applicable
There is no separate companion audio or video; the chart image is the full visual on this page.