Source page: McKinsey & Company
Commentary
Assets up, but profits stuck
Financial services | Resilience
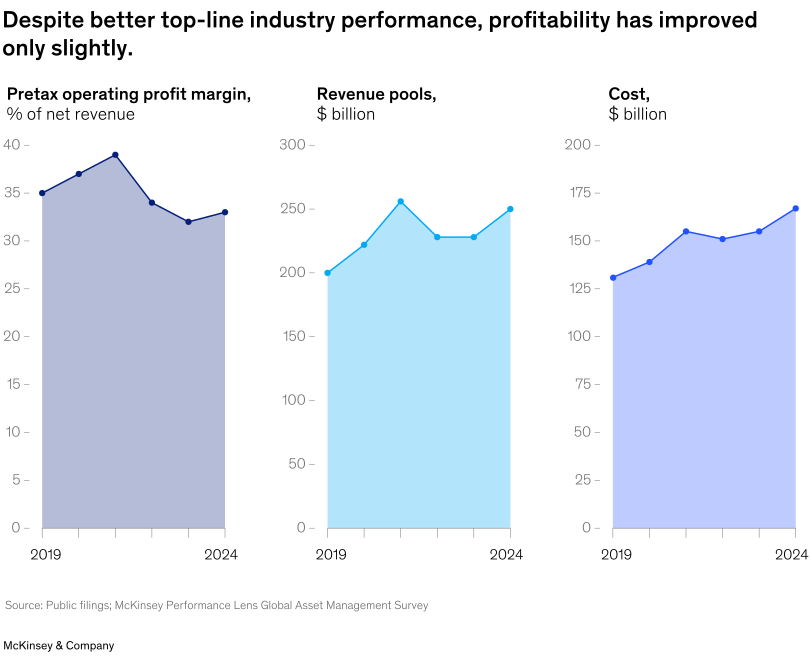
October 23, 2025 – After a bumpy start this year, markets hit their stride, helping boost global assets under management (AUM) to a record $147 trillion by June 2025. But although revenue pools increased by double-digit percentages from 2023 to 2024, pretax operating profit margins rose by only one percentage point, Senior Partner Ju-Hon Kwek and colleagues note. A few trends could reshape the industry, including a recalibration toward local investing and a convergence of alternative and traditional asset management.
To read the report, see “Asset management 2025: The great convergence,” September 18, 2025.
customizer here
Visual form
Three-panel line-and-area chart sequence covering margin, revenue pools, and cost.
Layout / body structure
The page is arranged as three small charts in a left-to-right row: pretax operating profit margin first, revenue pools second, and cost third. Each panel uses the same 2019 to 2024 time progression, with the filled area under the line emphasizing the level in each series.
What is being compared
It compares three industry measures over the same period: profit margin as a share of net revenue, total revenue pools in billions of dollars, and cost in billions of dollars.
Measurement system
The left panel is in percent of net revenue, while the middle and right panels are in billions of dollars. Each line has annual points from 2019 through 2024, so the reader can compare whether revenue and cost are moving faster than margin.
Visible structure inside the graphic
All three panels use a dark line over a light filled area. The profit-margin panel peaks early and then eases back, the revenue-pools panel rises and then flattens after its peak, and the cost panel climbs steadily with only a small pause before rising again.
Main takeaway from the visual
Revenue and assets have improved, but the profitability line does not climb in the same way because costs have risen enough to absorb much of the top-line improvement.
Key standout values or extremes
Pretax operating margin starts around 35 percent, peaks near 39 percent, and ends around 33 percent. Revenue pools move from about $200 billion to roughly $250 billion, while cost rises from about $130 billion to the high $160 billions, leaving only a modest improvement in profitability.
Controls / sequence, when applicable
This is a static chart image with no in-chart controls to operate.
Companion media, when applicable
There is no separate companion audio or video; the chart image is the full visual on this page.