Source page: McKinsey & Company
Commentary
The data center dividend
Artificial Intelligence | IT
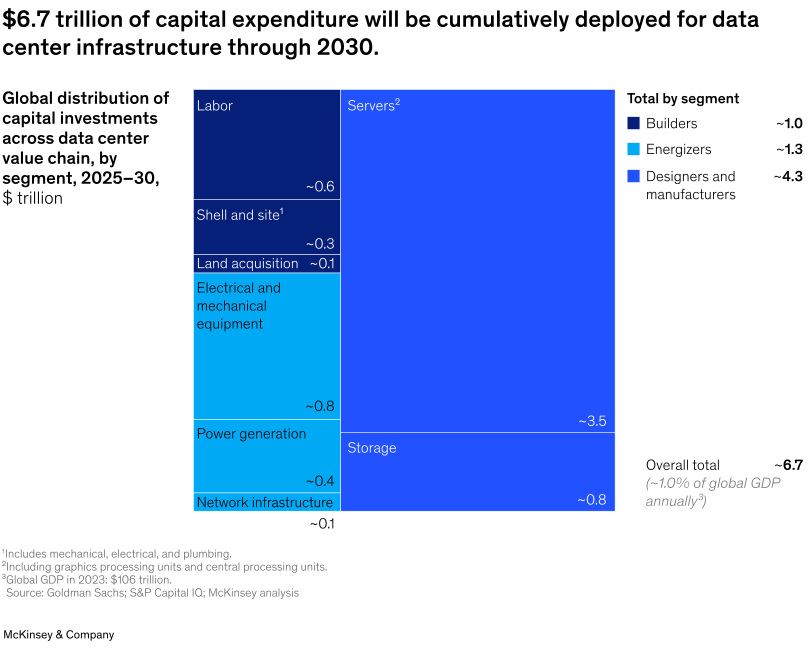
October 7, 2025 – Data centers are the backbone of the digital services that individuals, businesses, and governments rely on. Globally, data center investments are projected to reach nearly $7 trillion by 2030. More than $4 trillion will be allocated to computing hardware. With more than 40 percent of this spending expected to occur in the United States, each state can carefully assess costs and benefits to ensure optimal outcomes for their communities, note Senior Partner Adam Barth and coauthors. States that act strategically can ensure balanced growth, support sustainable infrastructure, and position themselves as leaders in fostering innovative, future-ready solutions.
To read the article, see “The data center balance: How US states can navigate the opportunities and challenges,” August 8, 2025.
customizer here
Visual form
Treemap-style capital-allocation chart for data center infrastructure spending.
Layout / body structure
The chart is a single treemap that reads by area, with the large central block split into spending categories and a summary list on the right showing segment totals. The notes and the overall-total callout sit beneath and beside the main rectangle.
What is being compared
It compares the projected global distribution of capital investments across the data center value chain from 2025 to 2030, separating servers, storage, electrical and mechanical equipment, power generation, labor, shell and site, land acquisition, and network infrastructure.
Measurement system
All amounts are measured in trillions of dollars. Rectangle area represents the size of each capital-expenditure category, and the internal labels use approximate values to show each segment’s contribution to the full total.
Visible structure inside the graphic
The largest rectangle is servers, which occupies most of the right side of the treemap. Storage forms a smaller block underneath it, while the left column is stacked with labor, shell and site, land acquisition, electrical and mechanical equipment, power generation, and network infrastructure. The right-hand list groups these components into builders, energizers, and designers and manufacturers.
Main takeaway from the visual
Most of the projected spending sits in hardware-heavy categories, especially servers, making designers and manufacturers the largest beneficiary segment within the data center build-out.
Key standout values or extremes
The overall total is shown as about $6.7 trillion through 2030. Servers alone account for about $3.5 trillion, storage about $0.8 trillion, electrical and mechanical equipment about $0.8 trillion, labor about $0.6 trillion, and power generation about $0.4 trillion. The segment summary on the right shows designers and manufacturers at about $4.3 trillion, energizers at about $1.3 trillion, and builders at about $1.0 trillion.
Controls / sequence, when applicable
This is a static chart image with no in-chart controls to operate.
Companion media, when applicable
There is no separate companion audio or video; the chart image is the full visual on this page.