Source page: McKinsey & Company
Commentary
AI shifts from novelty to necessity
Artificial Intelligence | Technology
September 3, 2025 – This week, our data visualizations focus on technology trends shaping our world, from the AI revolution to the future of energy and more.
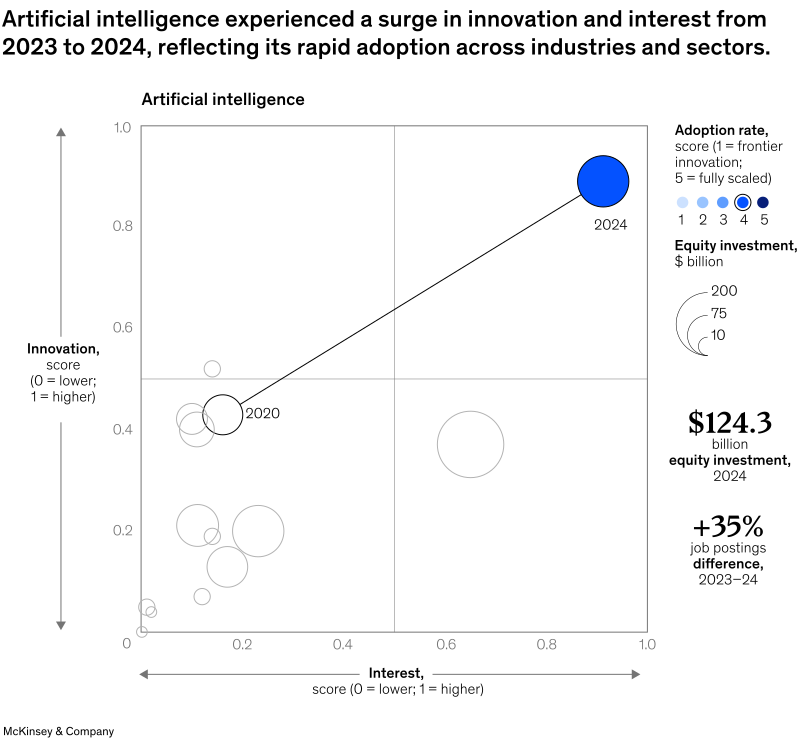
Artificial intelligence has had a big year. Evolving quickly from a technological novelty to an everyday tool, AI has surged in both adoption and investments since 2020. Equity investments in AI reached $124.3 billion in 2024, reflecting the increasing financial backing of AI technologies, note Senior Partner Sven Smit and coauthors. The job market for AI-related roles also expanded, with a 35 percent increase in job postings from 2023 to 2024. Despite widespread adoption of the technology, however, McKinsey research has found that only 1 percent of leaders believe their companies have reached full maturity in their AI deployments.
To read the report, see “McKinsey Technology Trends Outlook 2025,” July 22, 2025.
customizer here
Visual form
Bubble scatter plot.
Layout / body structure
This is a single scatter panel with a right-hand legend and metric sidebar. Reader scans the horizontal axis for interest, the vertical axis for innovation, and then uses bubble size and color to read investment and adoption levels.
What is being compared
It compares artificial intelligence across multiple years inside the same interest-versus-innovation framework, with the 2020 and 2024 positions explicitly highlighted against a field of other plotted points.
Measurement system
Interest is scored from 0 to 1 on the x-axis and innovation is scored from 0 to 1 on the y-axis. Bubble color indicates adoption rate on a five-point scale, bubble size shows equity investment in billions of dollars, and the sidebar adds the numeric headlines of 124.3 billion dollars of equity investment in 2024 and a 35 percent rise in job postings from 2023 to 2024.
Visible structure inside the graphic
Several pale bubbles cluster in the lower-left and middle-left part of the chart, while the labeled 2020 bubble sits around low-to-mid interest and mid-level innovation. A line then runs up and right to a large dark-blue 2024 bubble near the top-right corner, visually separating the later AI position from the earlier one. The right margin holds the adoption legend, bubble-size legend, and numeric callouts.
Main takeaway from the visual
The chart makes AI’s jump from emerging topic to dominant technology unmistakable by showing a strong movement from the middle of the chart in 2020 to a top-right, heavily funded, highly adopted position in 2024.
Key standout values or extremes
The sidebar calls out 124.3 billion dollars in equity investment for 2024 and a 35 percent increase in job postings from 2023 to 2024. Visually, the 2024 AI bubble is the most saturated and one of the most prominent points on the chart, and it sits much higher and farther right than the 2020 bubble.
Controls / sequence, when applicable
This is a static chart image with no in-chart controls to operate.
Companion media, when applicable
There is no separate companion audio or video; the chart image is the full visual on this page.