Source page: McKinsey & Company
Commentary
Decarbonizing a material world
Decarbonization | Sustainability
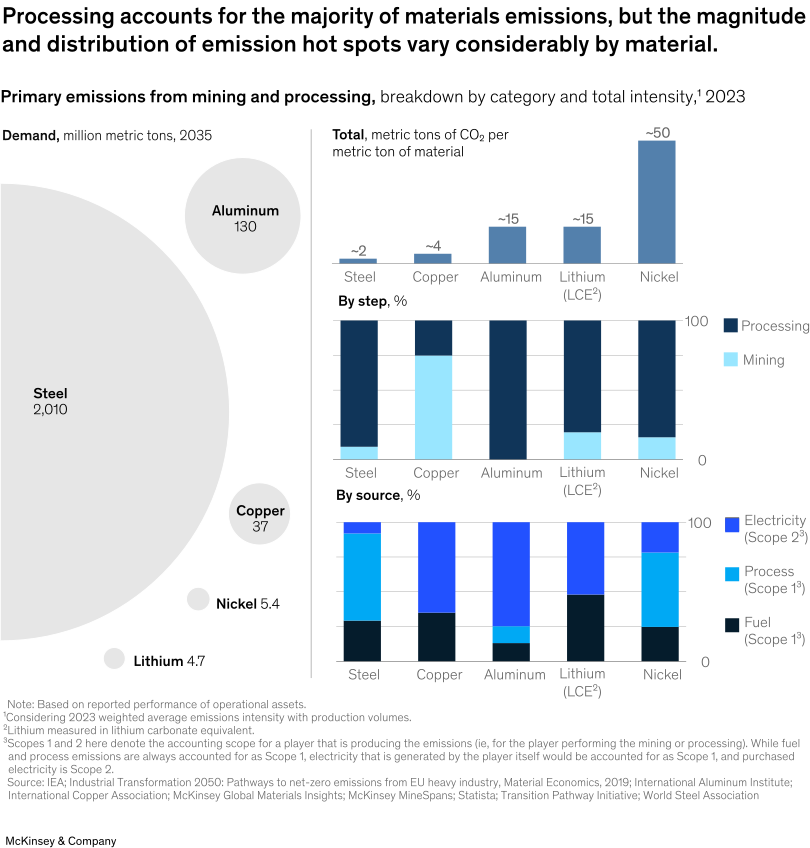
July 10, 2025 – The production of materials accounts for roughly 20 percent of global greenhouse gas emissions. Companies’ efforts to meet their emission-reduction targets is complicated by the fact that emission intensity and hotspots vary widely across materials, note Partner Peter Spiller and coauthors. An analysis reveals that processing operations are the primary source of emissions for most materials, outweighing those from mining. Steel and nickel, in particular, need to address Scope 1 (process) emissions to decarbonize effectively.
To read the article, see “Looking upstream: A path to unlocking low-carbon, circular materials,” June 3, 2025.
customizer here
Visual form
Single KPI / Metric, Bar Chart, and Stacked Bar / Stacked Column: multi-panel materials demand and emissions-intensity dashboard.
Layout / body structure
A large left panel compares 2035 demand by material with proportional bubbles. Three right-side panels compare total emissions intensity, emissions by production step, and emissions by source.
What is being compared
It compares steel, aluminum, copper, lithium, and nickel by demand volume, CO2 intensity per metric ton of material, mining-versus-processing emissions, and electricity/process/fuel emissions mix.
Measurement system
Demand is measured in million metric tons. Emissions intensity is measured in metric tons of CO2 per metric ton of material, while the stacked breakdown panels use percentage shares.
Visible structure inside the graphic
Steel dominates the demand panel, while nickel dominates the intensity bar chart. The lower stacked bars show that processing is the larger emissions step for most materials and that emissions sources vary by material.
Main takeaway from the visual
The chart shows that materials decarbonization has two different problems at once: huge demand volumes in some materials and very high emissions intensity in others.
Key standout values or extremes
Steel demand is the largest at 2,010 million metric tons, far above aluminum at 130, copper at 37, nickel at 5.4, and lithium at 4.7. Nickel is the emissions-intensity outlier at about 50 metric tons of CO2 per metric ton of material, while steel is about 2.
Controls / sequence, when applicable
This is a fixed multi-panel materials dashboard; there are no in-chart controls to operate.
Companion media, when applicable
There is no separate companion audio or video; the materials demand and emissions dashboard is the visual on this page.