Source page: McKinsey & Company
Commentary
Targeted ads take off
Consumer | Marketing & Sales
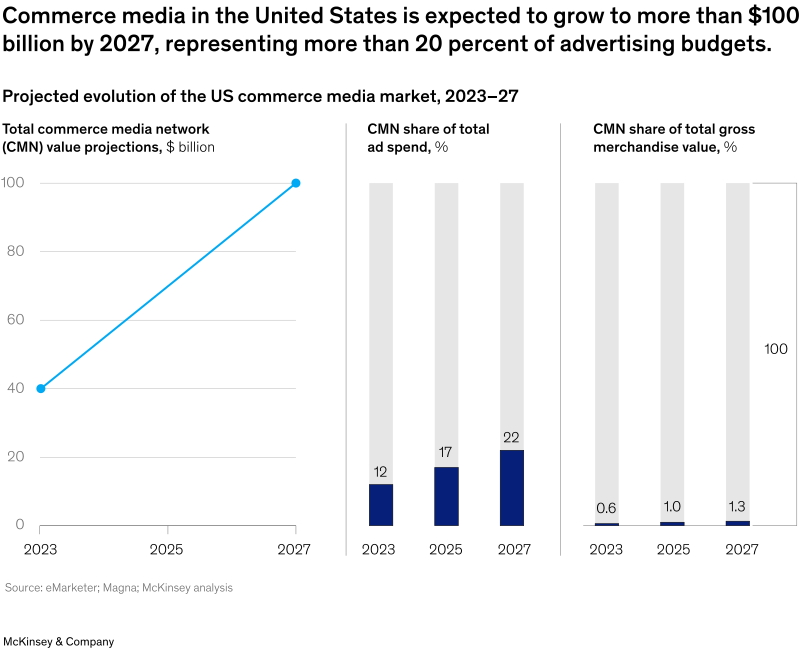
July 9, 2025 – Over the past three decades, the advertising industry has continuously transformed—from mass media like print and TV, which had few consumer insights, to retail media networks, which leveraged shoppers’ data to help brands reach customers. The latest shift comes from commerce media networks, which integrate ads directly into the customer experience across multiple online and offline channels beyond retail, note Senior Partner Marc Brodherson and coauthors. They project that by 2027, the US commerce media market will reach more than $100 billion.
To read the article, see “The evolution of commerce media: Navigating a new era in advertising,” May 29, 2025.
customizer here
Visual form
Three-panel market-growth chart with one line chart and two stacked column summaries.
Layout / body structure
The chart is arranged left to right in three vertical panels. The left panel shows total U.S. commerce-media market value over time, the middle panel shows commerce media as a share of ad spend, and the right panel shows commerce media as a share of gross merchandise value.
What is being compared
It compares the U.S. commerce media market across 2023, 2025, and 2027, first in absolute market size and then in two share-based measures tied to advertising budgets and gross merchandise value.
Measurement system
The left panel uses billions of dollars, the middle panel uses percent share of total ad spend, and the right panel uses percent share of total gross merchandise value. The values are printed directly on the columns or at the line endpoints.
Visible structure inside the graphic
The left panel is a simple line rising from about 40 in 2023 to just over 100 by 2027. The middle panel uses narrow columns labeled 12, 17, and 22 to show the share of ad spend. The right panel uses similarly narrow columns labeled 0.6, 1.0, and 1.3 to show the share of gross merchandise value. Vertical dividers separate the three measures so the reader can compare them side by side.
Main takeaway from the visual
The chart shows rapid and broad commerce-media expansion, not just in headline dollar size but also in its share of advertising budgets and its relevance to underlying merchandise value.
Key standout values or extremes
Total market value climbs from roughly 40 billion dollars in 2023 to more than 100 billion by 2027. Commerce media’s share of ad spend increases from 12 percent to 22 percent, while its share of gross merchandise value rises from 0.6 percent to 1.3 percent over the same period.
Controls / sequence, when applicable
This is a static chart image with no in-chart controls to operate.
Companion media, when applicable
There is no separate companion audio or video; the chart image is the full visual on this page.