Source page: McKinsey & Company
Commentary
Growth gains for budget airlines
Travel & Transportation
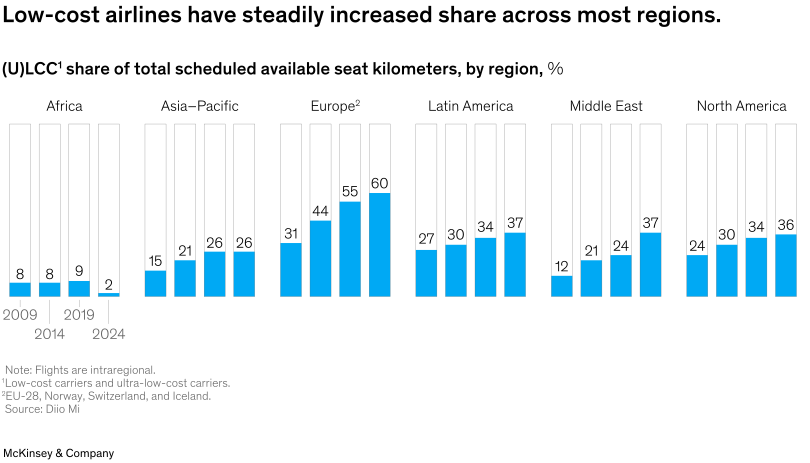
July 8, 2025 – In the years preceding the COVID-19 pandemic, budget airlines—also referred to as low-cost or ultra-low-cost airlines—experienced considerable growth. Across most regions, low-cost airlines have steadily increased their share of total scheduled available seat kilometers since 2009, Senior Partner Vik Krishnan and colleagues note. Europe has the highest share, followed by Latin America and the Middle East. Africa is the only region where the share of low-cost airlines has decreased postpandemic.
To read the article, see “Are low-cost airlines losing altitude?,” May 22, 2025.
customizer here
Section 2 Layout Outline
- Section frame
- The source-chart section sits between two horizontal separators.
- It is a vertical stack: title area, metadata/context text, source exhibit, then article citation.
- The source exhibit is the visual center of the section; the surrounding text identifies and documents it.
- Header area
- A single chart-source heading appears first.
- A short topic line sits directly below the heading.
- The date-led paragraph follows as the setup text for the exhibit.
- Exhibit placement
- The exhibit appears as one full-width image block below the setup paragraph.
- There are no side-by-side panels in the page section; the chart image carries the full visual layout.
- The image is an SVG source exhibit from McKinsey.
- Chart layout inside the exhibit
- The chart is a single-panel grouped vertical bar layout.
- Six regional groups run left to right across the chart.
- Each regional group contains a compact sequence of year bars.
- The bars share the same vertical scale so region groups can be compared against each other.
- Light outline bars provide the full-scale frame behind the filled bars.
- Exact percentage labels are printed on or near the bars, reducing dependence on an axis.
- Reading order
- Read down from the section title to the setup paragraph.
- Then scan the exhibit left to right by region.
- Within each region, read the year bars as a small time sequence.
- Use the printed values and bar heights together to compare growth, decline, and regional extremes.
- Footer citation
- An italic citation paragraph sits below the exhibit.
- It links out to the McKinsey article that the chart section is sourced from.
Visual form
Regional grouped bar chart.
Layout / body structure
The chart is a single panel read left to right by region. Each region contains a small run of vertical bars for successive years, allowing regional low-cost carrier share to be compared both over time and across geographies.
What is being compared
It compares the share of total scheduled available seat kilometers held by low-cost carriers across six regions: Africa, Asia-Pacific, Europe, Latin America, Middle East, and North America.
Measurement system
The metric is percentage share. Each regional mini-sequence uses directly labeled bars, so the reader tracks the level for the relevant years without needing a separate axis label on every cluster.
Visible structure inside the graphic
Africa shows small values around 8, 8, 9, and then 2. Asia-Pacific rises from 15 to 21 to 26 and then stays at 26. Europe climbs from 31 to 44 to 55 to 60. Latin America rises from 27 to 30 to 34 to 37, the Middle East from 12 to 21 to 24 to 37, and North America from 24 to 30 to 34 to 36. The empty outline bars behind the colored bars provide a consistent full-scale frame for each region.
Main takeaway from the visual
The chart shows that low-cost airlines have taken a growing share in most regions, with Europe reaching the highest share and the Middle East showing one of the sharpest upward moves.
Key standout values or extremes
Europe peaks at 60 percent, the highest level on the page. The Middle East jumps from 12 to 37, one of the strongest increases in the set. North America rises more moderately from 24 to 36, while Africa is the outlier with much lower values and a final reading of just 2.
Controls / sequence, when applicable
This is a static chart image with no in-chart controls to operate.
Companion media, when applicable
There is no separate companion audio or video; the chart image is the full visual on this page.