Source page: McKinsey & Company
Commentary
New era of industrial incentives
Industrials & Electronics | Geopolitics
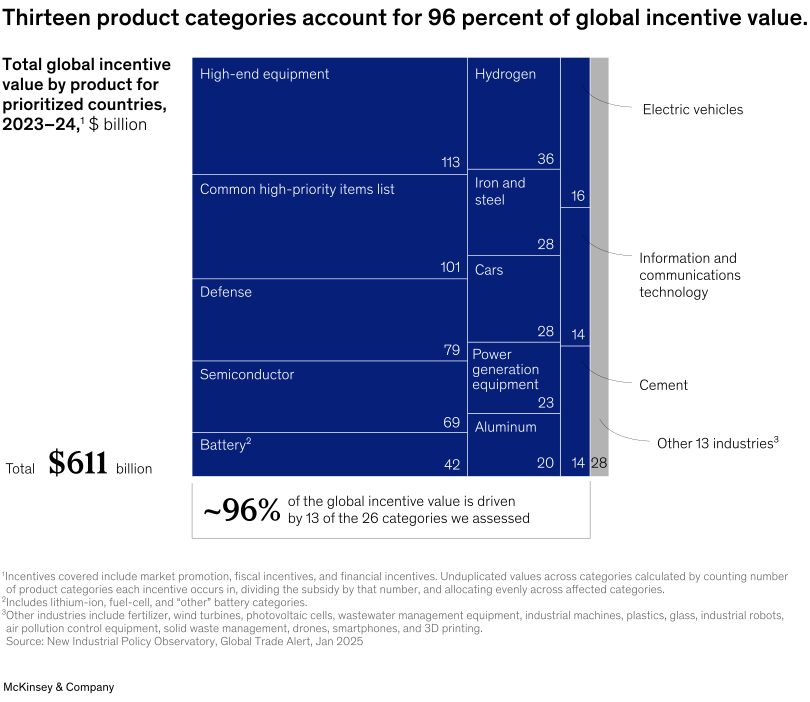
July 1, 2025 – Government subsidies, investment incentives, and other industrial-policy actions have almost quadrupled since 2017. But recent policies have often focused on specific industries and technologies, note Senior Partner Cindy Levy and coauthors. They analyzed subsidies across 26 product categories and found that in 2023 and 2024, 13 captured 96 percent of global incentive value, with the top five categories comprising about two-thirds of this total. In today’s geopolitical landscape, companies can gain a competitive advantage by integrating industrial-policy considerations into strategic decisions to lower capital costs, reduce risks in key innovation projects, and uncover new growth opportunities.
To read the article, see “From protection to promotion: The new age of industrial policy,” May 16, 2025.
customizer here
Visual form
Treemap of global incentive value by product category.
Layout / body structure
The chart is a single treemap with labels embedded in the rectangles and explanatory callouts on the right. Reader scans the largest blocks first, then follows the small right-side connectors to the narrower categories and the grouped other bucket.
What is being compared
It compares total global incentive value across product categories in prioritized countries during 2023 and 2024, showing which categories capture the overwhelming share of the total subsidy pool.
Measurement system
The values are in billions of dollars. Rectangle area represents category value, and a boxed note below summarizes the share of total incentive value captured by the top categories.
Visible structure inside the graphic
The largest rectangles are high-end equipment at 113 billion, a common high-priority items list at 101, defense at 79, semiconductor at 69, and battery at 42. A vertical strip of smaller rectangles to the right contains hydrogen at 36, iron and steel at 28, cars at 28, power-generation equipment at 23, and aluminum at 20, plus even narrower categories such as electric vehicles, information and communications technology, and cement. The bottom summary box states that about 96 percent of global incentive value is driven by 13 of the 26 categories assessed.
Main takeaway from the visual
The treemap shows that incentive value is highly concentrated rather than broadly distributed. A small set of industrial categories captures nearly the entire global pool, with the largest equipment and defense-related categories taking especially big shares.
Key standout values or extremes
The total charted value is 611 billion dollars. High-end equipment is the largest category at 113 billion, followed by the common high-priority items list at 101 and defense at 79. The summary box makes the concentration explicit by stating that roughly 96 percent of value comes from just 13 categories.
Controls / sequence, when applicable
This is a static chart image with no in-chart controls to operate.
Companion media, when applicable
There is no separate companion audio or video; the chart image is the full visual on this page.