Source page: McKinsey & Company
Commentary
Obesity's growing but unequal burden
Healthcare | Life Sciences | Public Health
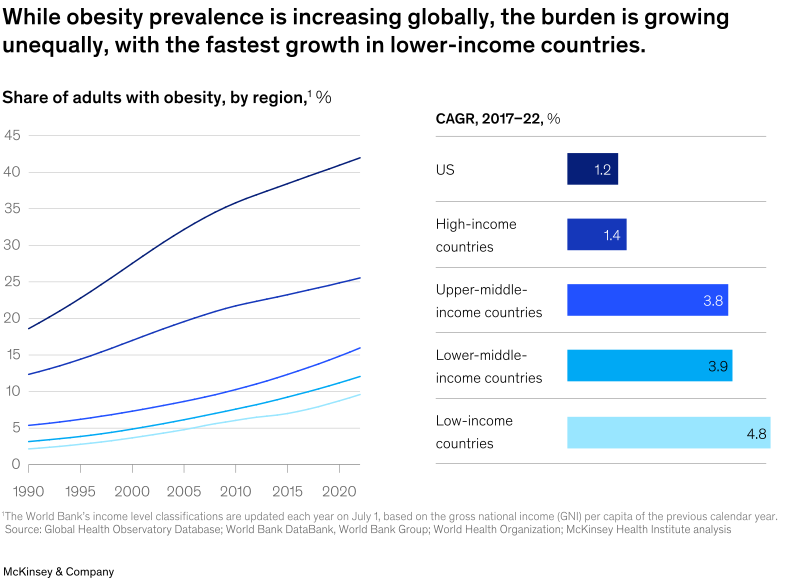
June 26, 2025 – Widespread obesity has emerged as a significant public health concern only in the past 50 years. Global prevalence continues to trend upward, but obesity rates are growing unequally. Between 2017 and 2022, lower-income countries had the biggest growth rates. Decision-makers face a choice between two possible paths forward, note Senior Partner Drew Ungerman and coauthors. While one focuses on treating obesity without addressing root causes, path two takes a holistic approach to metabolic health and includes prevention and treatment. It also would require changes across industries that include food, environmental, and social systems.
To read the report, see “The path toward a metabolic health revolution,” May 20, 2025.
customizer here
Visual form
Two-panel trend-and-growth chart with regional line chart and CAGR bar table.
Layout / body structure
The chart is laid out left to right. The left panel is a multi-line time series from 1990 through 2022, and the right panel is a ranked list of CAGR bars for income groups over 2017 to 2022.
What is being compared
It compares regional or income-group obesity prevalence over time and then compares the recent growth rate of obesity across the U.S., high-income countries, upper-middle-income countries, lower-middle-income countries, and low-income countries.
Measurement system
The left panel uses percentage share of adults with obesity, while the right panel uses CAGR percentages for 2017 to 2022. Line color differentiates the groups, and the right panel labels each bar with its exact CAGR value.
Visible structure inside the graphic
On the left, the darkest line climbs from the high teens in 1990 to above 40 by 2022, while the other four lines rise more gradually from lower starting points. On the right, horizontal bars list the U.S. at 1.2, high-income countries at 1.4, upper-middle-income countries at 3.8, lower-middle-income countries at 3.9, and low-income countries at 4.8. The right-hand ordering makes the growth-rate gradient by income level easy to read.
Main takeaway from the visual
The visual shows that obesity prevalence is rising everywhere, but the recent pace of increase is much faster in lower-income settings than in richer ones. The growth burden is therefore shifting unevenly rather than expanding at a uniform global rate.
Key standout values or extremes
The lowest recent CAGR is the U.S. at 1.2 percent, followed by high-income countries at 1.4. The highest is low-income countries at 4.8 percent, with lower-middle-income countries close behind at 3.9 and upper-middle-income countries at 3.8. On the historical line chart, the highest-prevalence series finishes above 40 percent by 2022.
Controls / sequence, when applicable
This is a static chart image with no in-chart controls to operate.
Companion media, when applicable
There is no separate companion audio or video; the chart image is the full visual on this page.