Source page: McKinsey & Company
Commentary
Closing the loop with circularity
Sustainability | Construction | Real estate
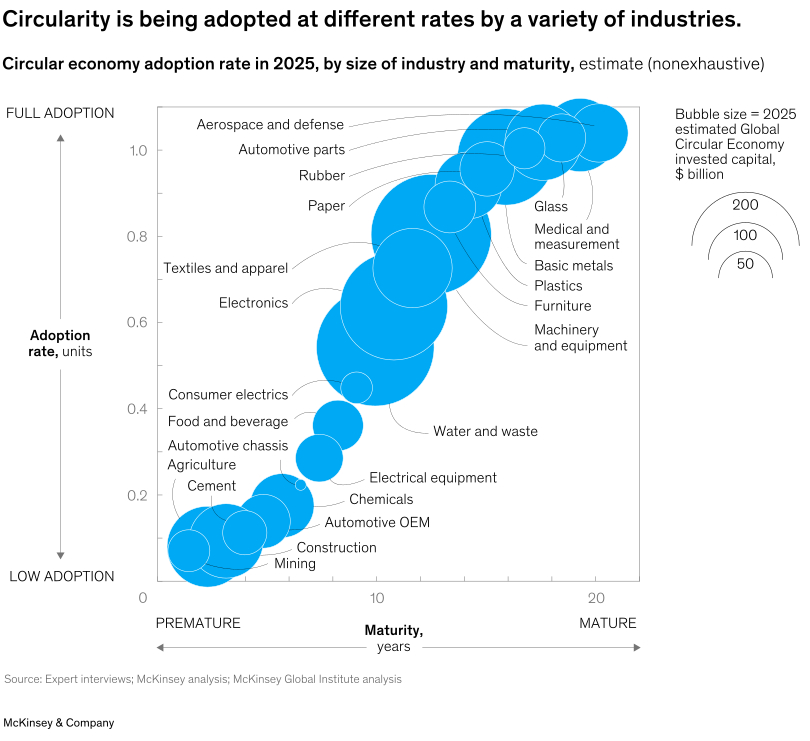
June 19, 2025 – The built environment makes up nearly 40 percent of global energy-related CO2 emissions. However, the use of circularity—a process that shifts a value chain from take, make, and dispose to one that continually reuses and repurposes materials to minimize waste and optimize resources—could abate as much as 13 percent of the built environment’s carbon emissions by 2030, Senior Partner Daniele Chiarella and coauthors explain. Some global industries, such as aerospace, automotive, and medical, have already demonstrated extensive adoption of circularity practices.
To read the article, see “How circularity can make the built environment more sustainable,” May 16, 2025.
customizer here
Visual form
Scatter Plot: bubble chart of circular-economy maturity, adoption, and invested capital by industry.
Layout / body structure
Industries are plotted on a single two-axis field, with maturity increasing from left to right and adoption increasing from bottom to top. Bubble size adds the capital-investment dimension.
What is being compared
It compares industries by how mature their circular-economy practices are, how widely those practices have been adopted, and how much circular-economy capital is invested in each sector.
Measurement system
The horizontal axis measures maturity in years, the vertical axis measures adoption rate, and bubble area represents estimated 2025 global circular-economy invested capital in billions of dollars.
Visible structure inside the graphic
Early and lower-adoption sectors cluster toward the lower-left, while more established circularity sectors move toward the upper-right. The bubble-size legend at right shows 50, 100, and 200 billion dollar reference circles.
Main takeaway from the visual
The chart shows that circularity adoption is uneven across industries, with some sectors still early and others already combining higher maturity with broader adoption.
Key standout values or extremes
Aerospace and defense and automotive parts sit near the mature, high-adoption end of the chart. Construction and mining sit closer to the low-maturity and low-adoption area, while some of the largest capital bubbles appear in the middle-to-upper part of the field.
Controls / sequence, when applicable
This is a fixed bubble scatter plot; there are no in-chart controls to operate.
Companion media, when applicable
There is no separate companion audio or video; the circularity maturity scatter plot is the visual on this page.