Source page: McKinsey & Company
Commentary
Consumer sentiment slides
Economy | Inflation
June 12, 2025 – Globally, consumer confidence continues to be subdued given that consumer prices have been persistently elevated and uncertainty is still high, note Senior Partner Sven Smit and coauthors. In March, US consumer confidence dropped once again because of stock market volatility and ongoing inflationary pressures. In April, the US consumer confidence index fell to 92.9, hitting its lowest point since 2022. In Brazil, consumer confidence remained below the neutral threshold of 100, falling to 84.6 in March.
To read the article, see “Global Economics Intelligence executive summary, April 2025,” May 29, 2025.
customizer here
Visual form
Area line chart around an index baseline.
Layout / body structure
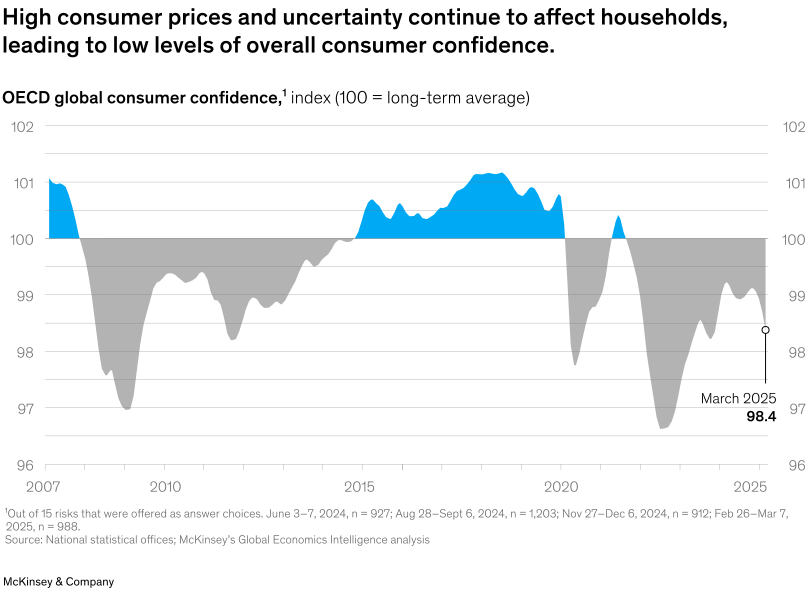
The chart is a single time series read left to right from 2007 to 2025. The line runs around a horizontal benchmark at 100, and the area fill changes color depending on whether confidence is above or below that baseline.
What is being compared
It compares OECD global consumer confidence over time against its long-term average, showing how households moved through pre-crisis levels, the financial crisis, the mid-2010s recovery, the pandemic shock, and the most recent period.
Measurement system
The vertical scale is an index where 100 equals the long-term average. Values above 100 are filled in blue and values below 100 are filled in gray, making positive and negative sentiment periods visually distinct.
Visible structure inside the graphic
The line begins a little above 101, drops sharply during the 2008 to 2009 crisis, recovers unevenly, then moves above 100 in the mid-to-late 2010s with a local high slightly above 101. It falls again around 2020, briefly recovers, then drops below 97 before improving partway. A callout at the right marks March 2025 at 98.4.
Main takeaway from the visual
The visual shows that consumer confidence remains subdued and fragile rather than fully recovered. Even after brief rebounds, the latest reading is still below the long-term average benchmark.
Key standout values or extremes
The most recent labeled point is March 2025 at 98.4, below the 100 baseline. The chart’s strongest above-average period is around 2018 to 2019 near 101, while the deepest trough appears in the early 2020s below 97.
Controls / sequence, when applicable
This is a static chart image with no in-chart controls to operate.
Companion media, when applicable
There is no separate companion audio or video; the chart image is the full visual on this page.