Source page: McKinsey & Company
Commentary
Let’s get flexible
Future of Work | Real estate | Remote work
June 5, 2025 – When it comes to work-from-home versus return-to-office arrangements, preferences vary substantially by occupation and sector, a McKinsey survey reveals. Hybrid work, however, tended to be the most favored option, particularly among office-based workers. Rather than adopting a one-size-fits-all approach, employers can benefit from customizing work arrangements to align with the unique demands of their sector and the roles they are filling, say Senior Partner Nora Gardner and coauthors. Real estate firms, in response to evolving work patterns, can adapt by designing office, residential, and retail spaces that support both professional and personal success.
To read the article, see “Flexible work’s enduring appeal affects workers, employers, and real estate,” May 6, 2025.
customizer here
Visual form
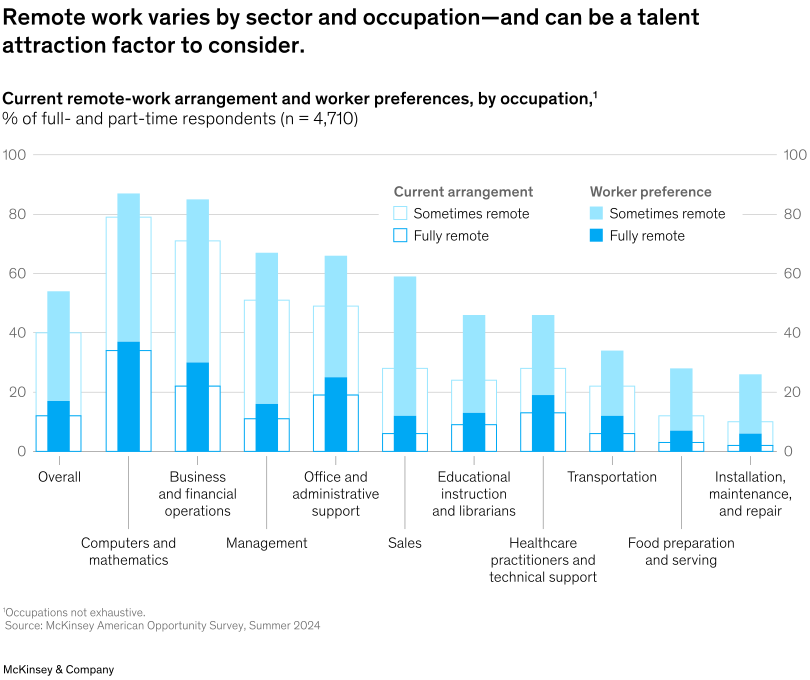
Grouped bar chart comparing current remote-work arrangements with worker preferences.
Layout / body structure
The chart is a single panel read left to right across occupations. Each occupation has two adjacent grouped columns: one for current arrangement and one for worker preference, and each of those columns is split into sometimes remote and fully remote components.
What is being compared
It compares occupations such as business and financial operations, computer and mathematics, management, office and administrative support, sales, educational instruction and librarians, healthcare practitioners and technical support, transportation, food preparation and serving, and installation maintenance and repair on both current remote-work arrangements and preferred remote-work arrangements.
Measurement system
The vertical axis is percentage share of full- and part-time respondents. Color shading distinguishes sometimes remote from fully remote, and a separate legend distinguishes current arrangement from worker preference.
Visible structure inside the graphic
For each occupation, the current arrangement pair sits beside the worker preference pair. Computer and mathematics has one of the highest remote totals in both current and preferred states, with the preferred stack rising above the current one. Business and financial operations and office and administrative support also show large remote-preference totals. Occupations such as food preparation and serving and installation maintenance and repair have much smaller bars on both the current and preferred sides.
Main takeaway from the visual
The chart shows that remote-work prevalence and appetite vary sharply by occupation, and in many white-collar roles worker preference for remote options runs above the current arrangement. That makes flexibility a real competitive lever in some talent markets and a much weaker one in others.
Key standout values or extremes
Computer and mathematics is among the highest-remote occupations, with the worker-preference stack reaching the upper 80s. Business and financial operations and office and administrative support also show strong preference totals in the mid-60s to mid-80s range. At the low end, installation maintenance and repair and food preparation and serving sit near the bottom with only very small fully remote shares.
Controls / sequence, when applicable
This is a static chart image with no in-chart controls to operate.
Companion media, when applicable
There is no separate companion audio or video; the chart image is the full visual on this page.