Source page: McKinsey & Company
Commentary
Watts next for the United States?
Energy
June 3, 2025 – The US energy sector fuels the nation’s economy, spanning AI, technology, education, healthcare, and manufacturing. Yet the country stands at the brink of a new energy era, with power demand projected to grow more than 3 percent annually through 2040. Addressing the anticipated challenges and opportunities for commercial, scientific, and technological advancement demands substantial innovation, investment, and political commitment, say Senior Partner Humayun Tai and coauthors.
To read the article, see “Powering a new era of US energy demand,” April 29, 2025.
customizer here
Visual form
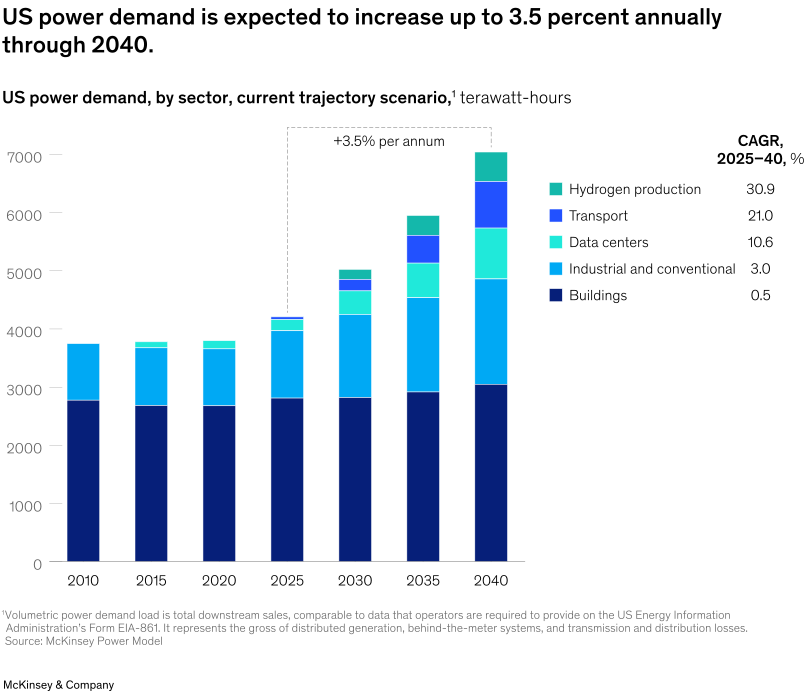
Stacked bar chart. The visual is a forward-looking sector breakdown of US power demand, with each column built from color-coded end uses.
Layout / body structure
The page shows a single chart centered on the page with the bars running left to right from 2010 through 2040 and a CAGR legend set off on the right. The main reading path is across the time axis and then to the side legend for the sector growth rates.
What is being compared
The chart compares US power demand over time across buildings, industrial and conventional uses, data centers, transport, and hydrogen production. It is showing how the total grows and how the mix shifts as newer demand sources take a larger share of the stack.
Measurement system
The y-axis is measured in terawatt-hours, and the right-side legend adds CAGR percentages for 2025 to 2040. Color is doing important work because each colored band maps to a sector, while the bar heights show total demand.
Visible structure inside the graphic
Each year is shown as a stacked column with a dark building base, a large industrial and conventional layer, and smaller but rising bands for data centers, transport, and hydrogen production. A dotted divider at 2025 and a plus-3.5-percent-per-annum note frame the later growth period, while the right-hand legend lists sector CAGRs in the same colors used inside the bars.
Main takeaway from the visual
The visible takeaway is that US power demand rises much faster after 2025 and that the new growth is concentrated in transport, data centers, and hydrogen rather than in buildings. Buildings stay the largest base layer for most of the series, but the fastest expansion clearly comes from the newer electrification and compute-heavy categories.
Key standout values or extremes
The total rises from a little over 4,200 terawatt-hours in 2025 to just above 7,000 terawatt-hours by 2040. The right-side CAGR list shows hydrogen production at 30.9 percent, transport at 21.0 percent, and data centers at 10.6 percent, while buildings grow only 0.5 percent over the same 2025-40 period.
Controls / sequence, when applicable
This is a static chart image with no in-chart controls to operate.
Companion media, when applicable
There is no separate companion audio or video; the chart image is the full visual on this page.