Source page: McKinsey & Company
Commentary
Africa's gen AI potential
Africa | Artificial Intelligence | Generative AI
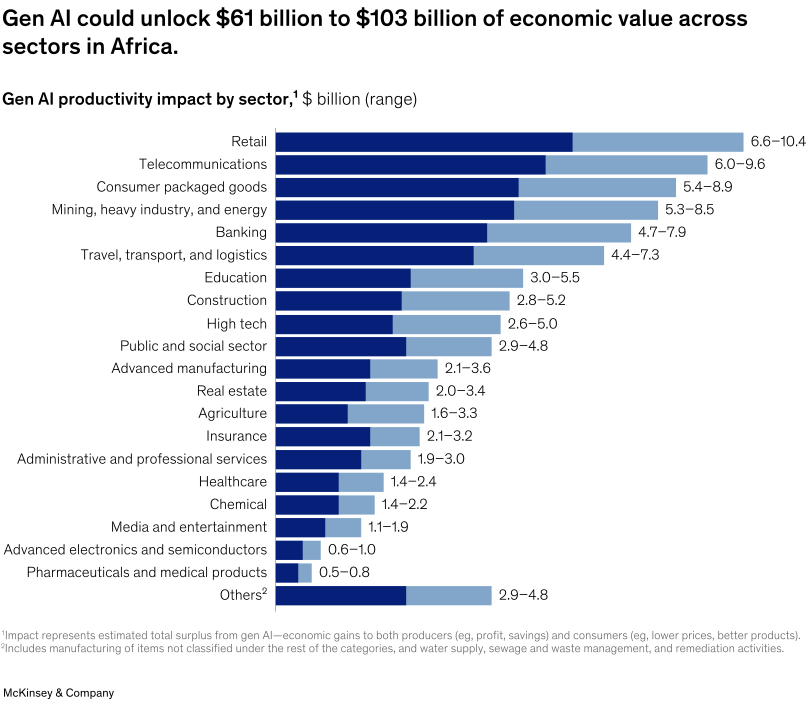
May 29, 2025 – Africa has embraced gen AI with remarkable speed, and its institutions are quickly catching up with and in some instances leading global developments. However, the continent’s progress so far with both gen AI and AI more broadly is only the tip of the iceberg, say Partner Mayowa Kuyoro and coauthors. Gen AI adoption varies widely by sector, with digitally mature sectors such as technology, telecommunications, and financial services leading the way. The authors estimate that at-scale deployment of gen AI could lead to $61 billion to $103 billion of additional economic value across Africa.
To read the report, see “Leading, not lagging: Africa’s gen AI opportunity,” May 12, 2025.
customizer here
Visual form
Horizontal ranked bar chart with ranges. The graphic is a sector-by-sector list of Gen AI value potential, drawn as bars that extend from low to high estimates.
Layout / body structure
The layout is a single chart with sectors listed from top to bottom and the largest ranges placed at the top of the ranking. Reader moves down the page through the sector list while reading the numeric range labels at the right edge of each bar.
What is being compared
The chart compares sectors in Africa by the amount of economic value Gen AI could unlock. It is comparing retail, telecommunications, consumer packaged goods, mining and energy, banking, travel and logistics, education, construction, and the rest of the ranked sectors against one another.
Measurement system
Values are shown in billions of dollars, and each bar is labeled as a range rather than as a single point estimate. The key thing to track is the span from the low estimate to the high estimate for each sector and where that range sits in the ranking.
Visible structure inside the graphic
Each sector occupies one horizontal row, with a dark blue starting segment and a lighter blue extension that carries the bar out to the upper end of the range. The sectors are ordered by scale, and the printed numbers at the right of each row give the exact low-to-high interval for that sector.
Main takeaway from the visual
The visible takeaway is that the largest Gen AI opportunity is concentrated in a handful of big commercial sectors rather than being spread evenly across the economy. Retail and telecommunications sit at the top, and there is a clear step-down from those leaders to the long tail of smaller sector opportunities lower in the chart.
Key standout values or extremes
Retail leads with a range of 6.6 to 10.4 billion dollars, followed by telecommunications at 6.0 to 9.6 and consumer packaged goods at 5.4 to 8.9. At the lower end of the ranking, advanced electronics and semiconductors show 0.6 to 1.0, and pharmaceuticals and medical products show 0.5 to 0.8, while the headline states an overall cross-sector total of 61 to 103 billion dollars.
Controls / sequence, when applicable
This is a static chart image with no in-chart controls to operate.
Companion media, when applicable
There is no separate companion audio or video; the chart image is the full visual on this page.