Source page: McKinsey & Company
Commentary
Tariff tangle for automakers
Economy | Global Trade | Automotive
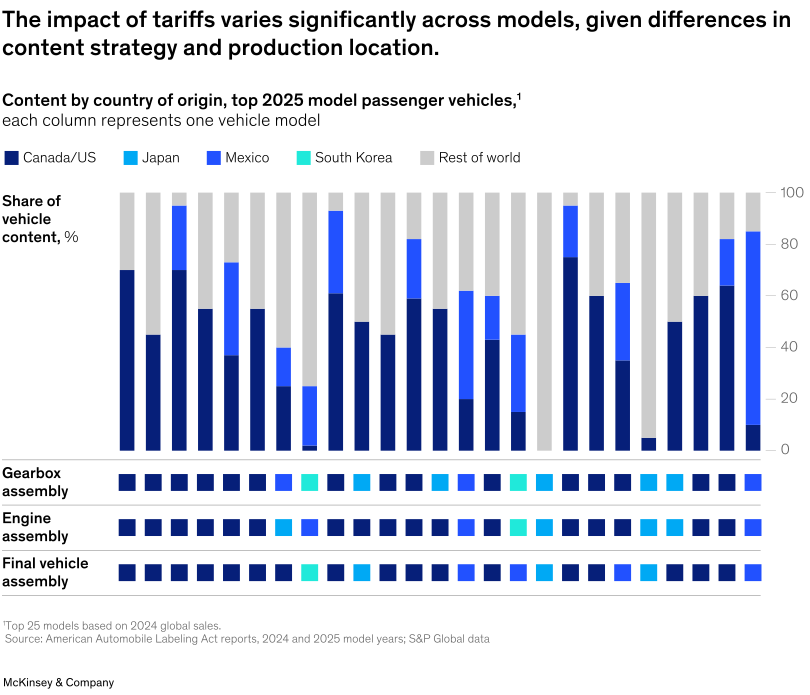
May 6, 2025 – The recent surge in trade controls and reciprocal tariffs is intense and unlike anything the world has seen since the 1930s. The impact on businesses is significant and unevenly distributed, say Senior Partner Cindy Levy and coauthors. In the automotive industry, for example, the origin of components differs widely by car model, making the effects of tariffs highly variable and triggering ripple effects through automakers’ supply chains.
To read the article, see “Navigating tariffs with a geopolitical nerve center,” April 11, 2025.
customizer here
Visual form
One-hundred-percent stacked column comparison with production-location markers. The chart shows how the country-of-origin content mix differs across top passenger vehicle models.
Layout / body structure
The layout is a single wide chart with many vehicle-model columns across the page and three marker rows below for gearbox assembly, engine assembly, and final vehicle assembly. The reading order is left to right across the model columns and then down to the assembly rows that explain how production footprints line up with the content stacks.
What is being compared
The chart compares the share of vehicle content coming from Canada and the United States, Japan, Mexico, South Korea, and the rest of the world across the top 2025 passenger vehicle models. It also compares where each model’s gearbox, engine, and final assembly are located.
Measurement system
Each column is a percentage share of vehicle content, so every stack sums to 100 percent. Color identifies origin countries or regions, while the rows beneath the chart use colored squares to mark the assembly location for each major production stage.
Visible structure inside the graphic
The main body of the visual is a run of narrow 100-percent stacked columns, most of them built from dark Canada or US blocks, bright blue Mexico blocks, and large gray rest-of-world blocks, with smaller contributions from Japan and South Korea. Beneath the stacks, three horizontal bands of colored squares show gearbox assembly, engine assembly, and final vehicle assembly for each model, turning the chart into a combined content-and-footprint map rather than a simple share chart.
Main takeaway from the visual
The visible takeaway is that tariff exposure differs sharply by model because both the content mix and the assembly footprint vary from car to car. Some models are concentrated in North American content, others depend heavily on Mexico or the rest of the world, and the three assembly rows show that manufacturing stages do not always line up with the dominant content source inside the stack above.
Key standout values or extremes
Several models are dominated by dark Canada or US content, while others carry very large Mexico segments that push close to or above half of the stack. At the other extreme, some models show the rest-of-world segment as the largest block, which makes the visual feel less like a single industry average and more like a series of sharply different sourcing profiles.
Controls / sequence, when applicable
This is a static chart image with no in-chart controls to operate.
Companion media, when applicable
There is no separate companion audio or video; the chart image is the full visual on this page.