Source page: McKinsey & Company
Commentary
Telco operators get B2B on the line
Technology | Telecommunications
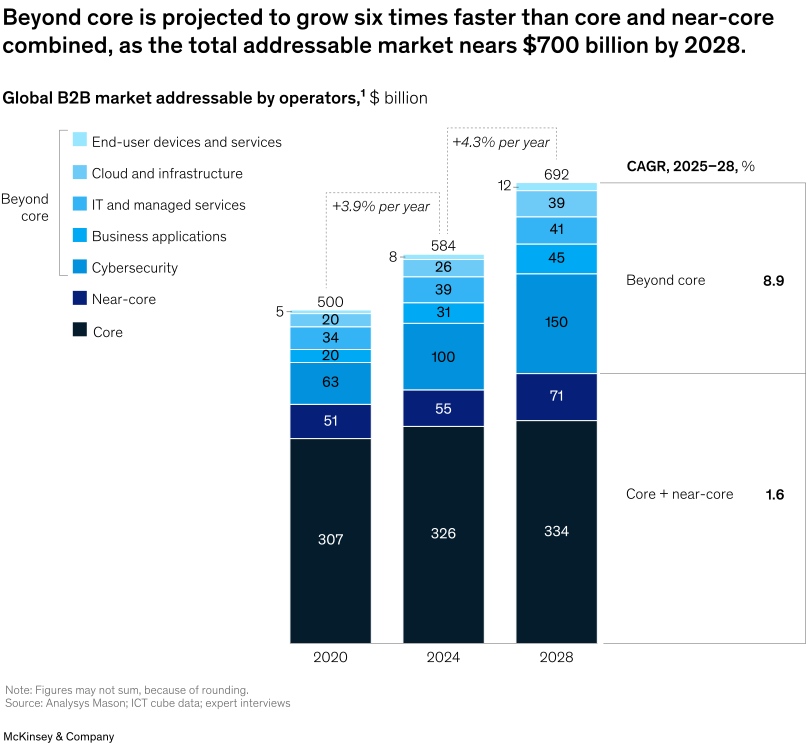
April 15, 2025 – The telecom and technology sectors are evolving rapidly, compelling telco operators to take decisive actions to maintain their market position. Partner Naveed Niwaz and coauthors highlight that one promising avenue for boosting B2B growth is in information and communications technology (ICT) by combining their connectivity services with offerings such as cybersecurity and cloud infrastructure. This beyond-core segment is expected to grow six times faster than the combined growth of core connectivity and near-core services. While telco operators already have a strong reputation in ICT, they must demonstrate their value as reliable integration partners.
To read the article, see “Playing to win in B2B telecom,” February 28, 2025.
customizer here
Visual form
Stacked time-series bar chart with a CAGR breakout panel. The chart shows the global B2B market addressable by operators and splits it into core, near-core, and multiple beyond-core segments.
Layout / body structure
The page is organized around three stacked columns for 2020, 2024, and 2028, with a boxed CAGR summary on the right. Reader moves left to right across the market-size columns and then to the side panel to compare growth rates for beyond core versus core and near-core combined.
What is being compared
The chart compares the size and composition of the operator-addressable B2B market across time. It distinguishes core, near-core, and beyond-core categories, and within beyond core it separates cybersecurity, business applications, IT and managed services, cloud and infrastructure, and end-user devices and services.
Measurement system
The stacks are measured in billions of dollars, and the CAGR box reports percentage growth from 2025 to 2028. Color is also critical because each shade marks a different segment of the addressable market.
Visible structure inside the graphic
Each year is shown as a tall stacked column with a dark core base, a near-core layer above it, and several lighter blue beyond-core layers stacked on top. Labels inside the segments show their sizes, small notations above the bars mark annual growth rates across the historical and projected periods, and the right-hand box isolates the CAGR comparison into two simple headline numbers.
Main takeaway from the visual
The visible takeaway is that the total addressable market gets much larger by 2028 and that most of the growth comes from beyond-core activities rather than from core connectivity. The beyond-core layers widen markedly over time, while the right-hand growth box shows that this part of the stack grows far faster than the lower core and near-core base.
Key standout values or extremes
The total grows from 500 billion dollars in 2020 to 584 billion in 2024 and 692 billion in 2028. The CAGR box shows beyond core growing at 8.9 percent from 2025 to 2028 versus only 1.6 percent for core plus near-core, and the largest beyond-core segment reaches 150 billion by 2028 while core rises only from 307 to 334 over the full 2020 to 2028 span.
Controls / sequence, when applicable
This is a static chart image with no in-chart controls to operate.
Companion media, when applicable
There is no separate companion audio or video; the chart image is the full visual on this page.