Source page: McKinsey & Company
Commentary
Sportswear slowdown
Consumer | Sustainability
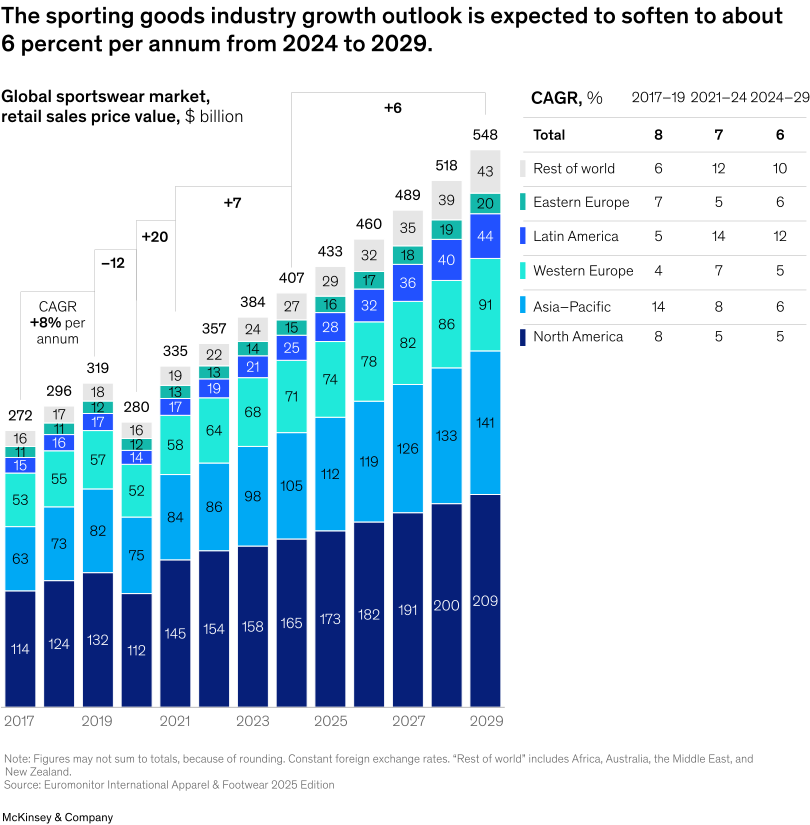
April 8, 2025 – After growing at 7 percent per year for the past three years, the global sportswear market is projected to grow at 6 percent annually from 2024 to 2029. Slowdowns in the Asia–Pacific, Western Europe, and Latin America regions are driving the change, according to Senior Partner Becca Coggins and colleagues.
To read the report, see “Sporting Goods 2025—The new balancing act: Turning uncertainty into opportunity,” March 4, 2025.
customizer here
Visual form
Stacked bar chart with a side CAGR breakout table.
Layout / body structure
The chart is laid out as one central time-series stack of annual bars, with a compact growth-rate table aligned on the right. Read the stacked bars from left to right across the years first, then use the right-hand CAGR column set to compare regional growth rates across the earlier and later periods.
What is being compared
It compares the size of the global sportswear market over time and also compares the regional composition of that market within each year. The side table extends the comparison by showing how growth rates differ across regions and periods, including the projected 2024 to 2029 window.
Measurement system
The main bars are measured in billions of dollars at retail sales price value, while the table uses CAGR percentages. The legend separates the regional color stacks, and the total market values are shown at the tops of the annual columns.
Visible structure inside the graphic
The graphic is organized around vertically stacked annual bars for 2017 through 2029, with each bar split into Rest of world, Eastern Europe, Latin America, Western Europe, Asia-Pacific, and North America. A narrow table on the right lists CAGR values for the same regional groups across three time windows, so the chart combines level, mix, and growth in one view.
Main takeaway from the visual
The visual shows that the market keeps expanding but at a slower projected pace than in the recent rebound period. The bars keep rising toward 2029, yet the right-side CAGR table makes the moderation plain by showing the total growth outlook easing to about 6 percent per year for 2024 to 2029.
Key standout values or extremes
The total market rises from 272 billion dollars in 2017 to 548 billion dollars by 2029. North America remains the largest visible regional block at 209 billion dollars in 2029, Asia-Pacific reaches 141 billion, and the total CAGR row steps down from 8 percent in 2017 to 2019 and 7 percent in 2021 to 2024 to 6 percent in 2024 to 2029.
Controls / sequence, when applicable
This is a static chart image with no in-chart controls to operate.
Companion media, when applicable
There is no separate companion audio or video; the chart image is the full visual on this page.