Source page: McKinsey & Company
Commentary
Boomers budget, millennials splurge
Consumer | Economics | Retail
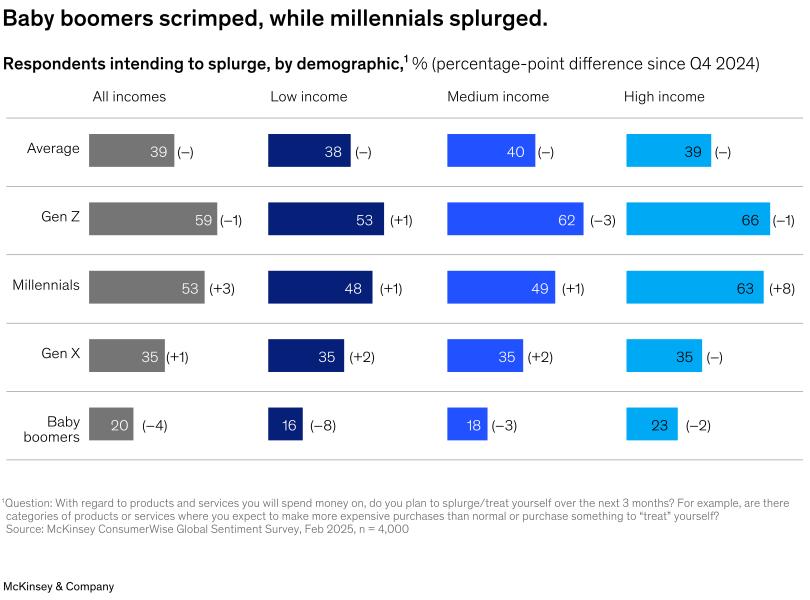
March 27, 2025 – At the start of the year, US consumers maintained a positive outlook on the economy, but spending expectations varied across demographic groups, according to Senior Partner Becca Coggins and her coauthors. In McKinsey’s recent ConsumerWise survey, each generation showed distinct intentions to splurge, whether to make an expensive purchase or treat themselves. Only 20 percent of baby boomers, regardless of income, said they were likely to splurge. In contrast, about half of millennials expressed an intention to splurge.
To read the article, see “An update on US consumer sentiment: Is growing uncertainty casting a chill on spending plans?,” February 28, 2025.
customizer here
Visual form
Grid-style comparison chart built from small horizontal bars and change labels.
Layout / body structure
The chart is arranged like a matrix, with demographic groups in rows and income bands in columns. Read left to right across each row to compare how the same generation behaves across income levels, then move top to bottom to compare the generations against one another.
What is being compared
It compares the share of respondents intending to splurge across generations and across income groups. The chart also compares the percentage-point change since Q4 2024, which appears beside each bar as a small delta label.
Measurement system
The main values are percentages, and the secondary values are percentage-point differences since Q4 2024. Column headings separate all incomes, low income, medium income, and high income, while each row identifies a generation.
Visible structure inside the graphic
The graphic is organized as a table-like grid of compact horizontal bars, one bar in each demographic and income cell. Each bar carries its percentage value inside the shape, and a change marker in parentheses sits beside it so the chart shows both current intent and recent movement in the same cell.
Main takeaway from the visual
The visual shows a strong generational split in willingness to splurge, with younger consumers consistently higher and baby boomers consistently lower. Millennials and Gen Z occupy the top end of most cells, while baby boomers are the most restrained across every income band.
Key standout values or extremes
The highest visible value is 66 percent for high-income Gen Z, while high-income millennials also stand out at 63 percent. At the low end, baby boomers fall to 16 percent in the low-income column and only 23 percent even in the high-income column, while the overall average stays near 39 to 40 percent across income bands.
Controls / sequence, when applicable
This is a static chart image with no in-chart controls to operate.
Companion media, when applicable
There is no separate companion audio or video; the chart image is the full visual on this page.