Source page: McKinsey & Company
Commentary
IT maturity matters in telecom
Telecommunications | IT
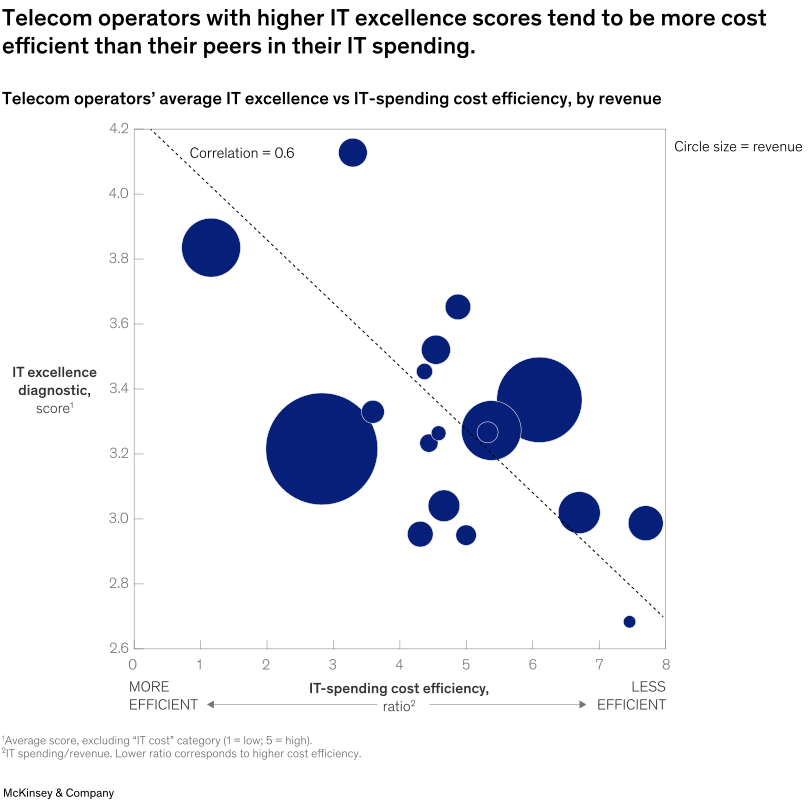
March 25, 2025 – Telecom operators with greater IT excellence tend to be more cost-efficient with IT spending than their peers. Operators in the top quartile of IT maturity grow revenues at a higher rate of profitability than operators as a whole, with a roughly 15.5 percent net operating profit after tax, compared with 14 percent, note Partner Duarte Begonha and colleagues. Operators with greater IT maturity also demonstrate better customer satisfaction.
To read the article, see “Transforming telecom tech: How IT excellence drives innovation and cost efficiency,” February 28, 2025.
customizer here
Visual form
Bubble scatter plot.
Layout / body structure
The chart is a single chart with bubbles plotted on two numeric axes and a dashed trend line crossing the field. Read the horizontal axis left to right for IT-spending cost efficiency, the vertical axis bottom to top for IT excellence score, and then compare bubble size to judge relative revenue scale.
What is being compared
It compares telecom operators’ IT excellence scores against their IT-spending cost-efficiency ratios. At the same time, bubble size adds a third comparison by showing how large each operator is by revenue.
Measurement system
The vertical axis uses an IT excellence diagnostic score, the horizontal axis uses an IT-spending cost-efficiency ratio, and bubble area represents revenue. The chart also includes a dashed correlation line and a printed correlation value, so the reader is following both point placement and the overall directional relationship.
Visible structure inside the graphic
The graphic is organized as a field of circles of different sizes scattered across the plot, with a descending dashed line drawn through them. The largest bubbles sit among a cluster in the middle ranges, while a few higher-scoring or less efficient outliers sit apart from the denser center of points.
Main takeaway from the visual
The visual shows a positive relationship between stronger IT excellence and greater cost efficiency in telecom operations. Operators that score higher on the excellence diagnostic tend to sit farther toward the more efficient side of the chart, which is why the overall relationship is summarized with a correlation of 0.6.
Key standout values or extremes
The chart explicitly labels the correlation at 0.6. One of the highest points sits a little above 4.1 on the IT excellence scale, while the least efficient edge of the horizontal axis stretches toward about 8, and the largest revenue bubbles are concentrated in the middle of the plotted field rather than at the outer extremes.
Controls / sequence, when applicable
This is a static chart image with no in-chart controls to operate.
Companion media, when applicable
There is no separate companion audio or video; the chart image is the full visual on this page.