Source page: McKinsey & Company
Commentary
Banks’ mobile mastery
Financial services | Digital
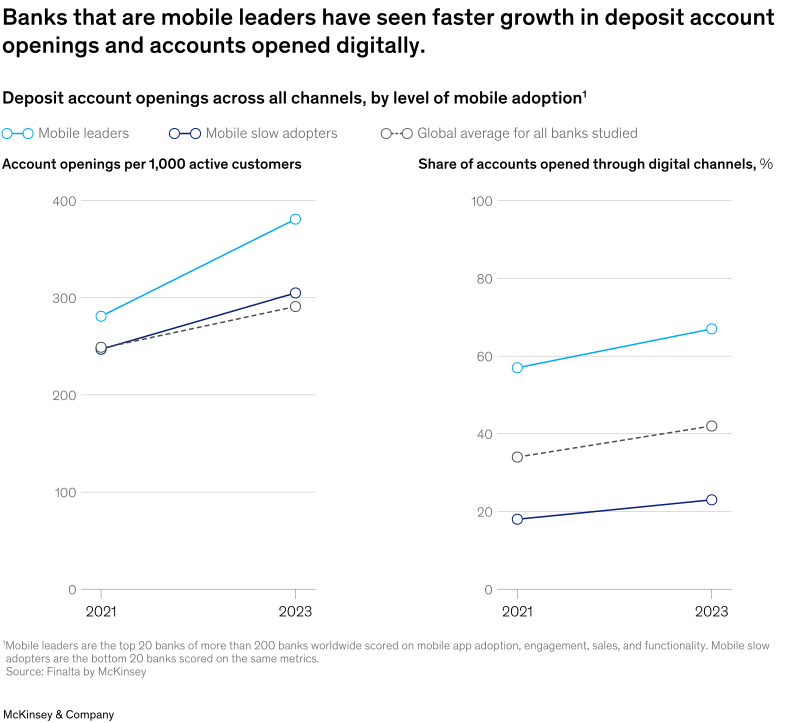
March 12, 2025 – Banks that lead in mobile adoption experienced significantly faster deposit account growth than their slower-adopting counterparts from 2021 to 2023, according to an analysis of 200 banks across the world. Senior Partner Max Flötotto and coauthors note that this growth is reflected in both the total number of accounts opened and the proportion opened via digital channels. Mobile leaders opened 381 deposit accounts per 1,000 active customers, on average, in 2023, a 35 percent increase from 2021. By comparison, the global average share of account openings for all banks studied during that time was 17 percent.
To read the article, see “Deposits: The top profitability lever for retail banks’ CEOs,” February 6, 2025.
customizer here
Visual form
Two-panel line chart.
Layout / body structure
The chart is split into two side-by-side panels that share the same two-year comparison window. Read the left panel first for account openings per 1,000 active customers, then read the right panel for the share of accounts opened through digital channels.
What is being compared
It compares mobile leaders, mobile slow adopters, and the global average for banks on two related measures: account-opening volume and digital-channel share. Both panels compare 2021 against 2023 so the reader can see how differences in mobile adoption line up with operating outcomes.
Measurement system
The left panel uses account openings per 1,000 active customers, and the right panel uses percentage share of accounts opened through digital channels. Color distinguishes mobile leaders, slow adopters, and the global average, while the two points in each line anchor the 2021-to-2023 change.
Visible structure inside the graphic
Each panel contains three simple two-point lines, one for each banking group. The left panel emphasizes absolute opening rates, while the right panel emphasizes channel mix, letting the reader compare growth and digitization side by side.
Main takeaway from the visual
The visual shows that banks leading in mobile adoption pulled ahead on both deposit-account growth and digital-account-opening share. In both panels, the mobile-leader line starts above the others and then rises further, widening the gap by 2023 rather than converging back toward the average.
Key standout values or extremes
In the left panel, mobile leaders rise from roughly 280 to about 380 account openings per 1,000 active customers, while slow adopters rise only to about 305 and the global average to around 292. In the right panel, mobile leaders increase from about 57 percent to 67 percent digital share, well above the global average near 42 percent and slow adopters near 23 percent in 2023.
Controls / sequence, when applicable
This is a static chart image with no in-chart controls to operate.
Companion media, when applicable
There is no separate companion audio or video; the chart image is the full visual on this page.