Source page: McKinsey & Company
Commentary
Solar installation swings with policy shifts
Electric power and natural gas | Renewable energy | Sustainability
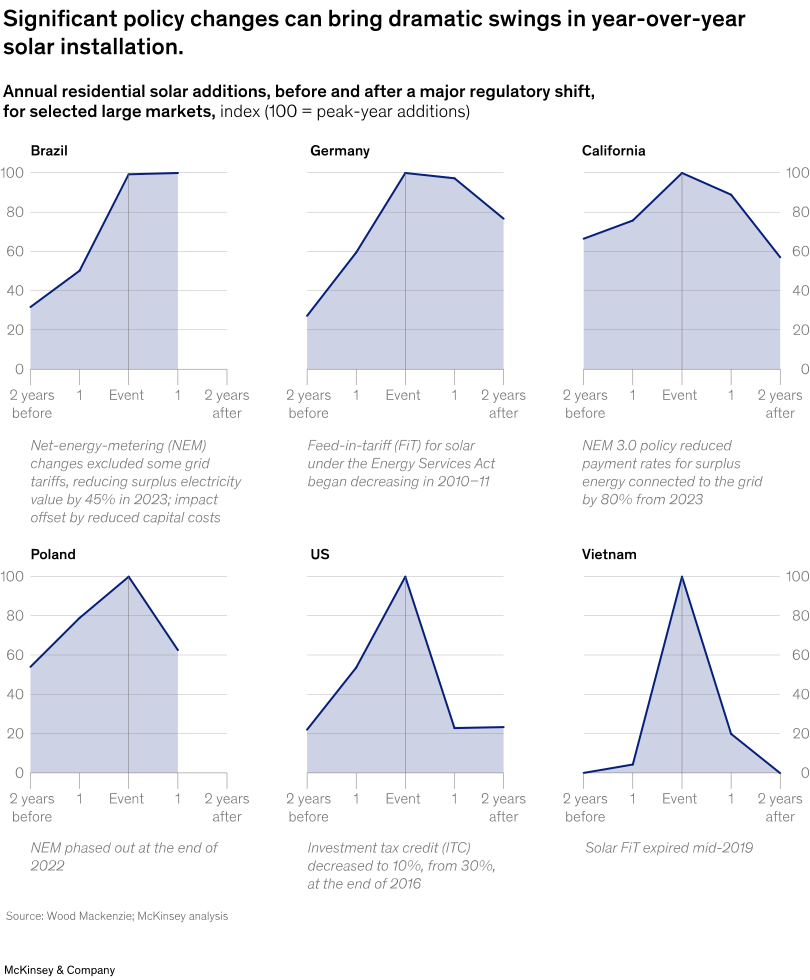
March 11, 2025 – Regulatory changes significantly affect residential solar projects. Policy shifts, such as the addition or removal of compensation mechanisms like net-energy metering or feed-in tariffs, can cause dramatic year-over-year increases or decreases in the installation of residential solar projects in markets worldwide, note Senior Partner Scott Perl and colleagues.
To read the article, see “Residential solar: Down, not out,” February 3, 2025.
customizer here
Visual form
Six-panel small-multiple line-and-area chart.
Layout / body structure
The chart is arranged as a grid of country panels, each centered on a marked policy event. Read each panel from two years before the event through two years after it, then compare the shapes across Brazil, Germany, California, Poland, the United States, and Vietnam.
What is being compared
It compares annual residential solar additions before and after a major regulatory or policy shift in selected large markets. The main comparison is how sharply installations rise into the event and how differently they fall, flatten, or hold afterward by geography.
Measurement system
Each panel uses an index where 100 equals peak-year additions. The horizontal axis is event-relative time rather than calendar year, and the shared vertical scale lets the reader compare the severity of pre- and post-policy swings across markets.
Visible structure inside the graphic
Every panel contains a dark line with a pale filled area beneath it, plus a vertical reference line at the event. The repeated panel design makes it easy to compare the shape of each market’s boom and subsequent correction or stabilization.
Main takeaway from the visual
The visual shows that large policy shifts can create abrupt solar-installation booms followed by equally sharp contractions, but the size and persistence of the swing differ by market. The United States and Vietnam show especially steep post-event collapses, while Germany and California decline more gradually after their peaks.
Key standout values or extremes
Several panels reach the indexed peak of 100 at the event or just before it, but Vietnam then drops to roughly 20 one year later and back toward zero by two years after. The United States also falls from about 100 at the event to the low 20s one year after, whereas Germany remains closer to the upper 70s by two years after its shift.
Controls / sequence, when applicable
This is a static chart image with no in-chart controls to operate.
Companion media, when applicable
There is no separate companion audio or video; the chart image is the full visual on this page.