Source page: McKinsey & Company
Commentary
A PE pharma deal decline
Pharmaceuticals & Medical Products | Private equity
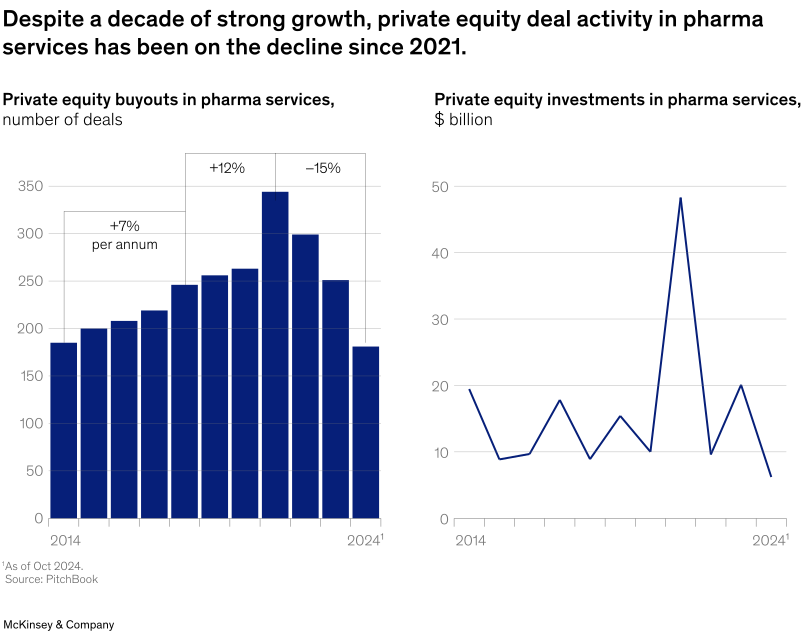
February 27, 2025 – Private equity (PE) deal activity in pharmaceutical supply chain services showed steady growth over the past decade, but that trend shifted postpandemic. Since 2021, PE buyouts and investments in pharma services have declined, Partner Clay Bischoff and coauthors note, and PE deal activity fell by 15 percent per year between 2021 and 2023. However, the global pharma supply chain services industry has a profit pool of about $77 billion, composed of high-growth subsegments such as raw materials and consumables that represent opportunities for PE investors.
To read the article, see “From discovery to delivery: Finding an investment edge in biopharma services,” January 29, 2025.
customizer here
Visual form
Two-panel chart with a bar chart on the left and a line chart on the right.
Layout / body structure
The chart is split into two side-by-side panels covering the same 2014 to 2024 period. Read the left panel first for the number of private-equity buyouts in pharma services, then read the right panel for the dollar value of private-equity investments over the same years.
What is being compared
It compares deal count and investment value in private-equity pharma-services activity over time. The side-by-side design lets the reader see whether transaction volume and invested dollars move together or diverge after the 2021 peak.
Measurement system
The left panel is measured in number of deals, while the right panel is measured in billions of dollars. Both panels use annual time on the horizontal axis, and the left panel also adds summary growth annotations for the earlier and later subperiods.
Visible structure inside the graphic
The left panel is built from annual vertical bars, with bracketed annotations above the bars marking growth rates before and after the turning point. The right panel is a simple annual line, making it easier to see spikes and reversals in invested capital without the heavier bar structure.
Main takeaway from the visual
The chart shows that pharma-services private-equity activity grew strongly for years and then turned downward after 2021. The left bars climb steadily into a peak and then fall, and the right-hand value line also becomes more erratic and lower after its sharp spike.
Key standout values or extremes
Buyout count rises from roughly 185 deals in 2014 to a peak a little above 340 around 2021, then falls to about 180 by 2024. The left annotations show about 7 percent annual growth in the earlier stretch, 12 percent annual growth into the peak, and a 15 percent decline afterward, while the right panel spikes near 48 billion dollars before dropping back toward the single digits by 2024.
Controls / sequence, when applicable
This is a static chart image with no in-chart controls to operate.
Companion media, when applicable
There is no separate companion audio or video; the chart image is the full visual on this page.