Source page: McKinsey & Company
Commentary
Europe’s energy evolution
Decarbonization | Renewable energy
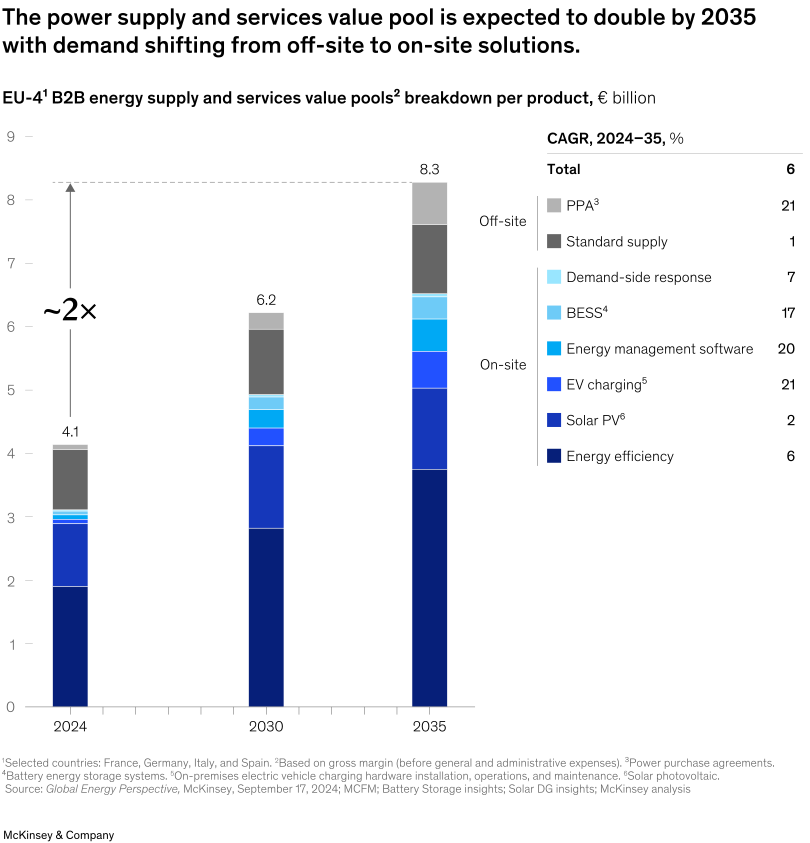
February 20, 2025 – Energy companies and new market entrants could capture potential value in energy services and supply in Europe. The value of the European Union’s B2B energy supply and services is projected to double in size by 2035, reaching €8.3 billion. Partner Bruno Esgalhado and coauthors explain that this growth may be propelled by a shift in their customers’ demand for off-site to on-site solutions. On-site solutions in particular, such as electric vehicle charging and energy management software, are expected to experience the most substantial growth.
To read the article, see “Improving B2B energy propositions: Four trends reshaping the industry,” January 27, 2025.
customizer here
Visual form
Stacked column chart with a side CAGR table.
Layout / body structure
The chart is built around three stacked columns for 2024, 2030, and 2035, with a legend and CAGR breakdown table positioned on the right. Read the columns left to right to see how the value pool grows and how the mix shifts, then use the right-hand CAGR list to compare growth rates by product segment.
What is being compared
It compares EU-4 B2B energy supply and services value pools over time and across product categories. The main comparison is between off-site solutions such as PPAs and standard supply and on-site solutions such as demand-side response, battery storage, energy-management software, EV charging, solar PV, and energy efficiency.
Measurement system
The columns are measured in billions of euros, while the right-side table uses CAGR percentages for 2024 to 2035. Color segments identify the product categories, and the total column heights are labeled directly above the stacks.
Visible structure inside the graphic
The graphic is organized as three stacked columns with a visual brace separating the off-site layers at the top from the larger on-site layers beneath them. A right-hand legend and CAGR list translate the colors and quantify which segments grow fastest over the period.
Main takeaway from the visual
The visual shows the value pool nearly doubling by 2035, with the growth engine shifting toward on-site solutions rather than traditional off-site supply. The lower on-site segments expand more visibly over time, while the total column rises from just over 4 billion euros to more than 8 billion euros.
Key standout values or extremes
The total increases from 4.1 billion euros in 2024 to 6.2 billion in 2030 and 8.3 billion in 2035, which the chart labels as roughly a 2x expansion. On the CAGR table, PPA and EV charging each show 21 percent growth, energy-management software shows 20 percent, battery energy storage systems show 17 percent, and standard supply grows only 1 percent.
Controls / sequence, when applicable
This is a static chart image with no in-chart controls to operate.
Companion media, when applicable
There is no separate companion audio or video; the chart image is the full visual on this page.