Source page: McKinsey & Company
Commentary
Happy workplaces outperform indexes
Workplace | Productivity
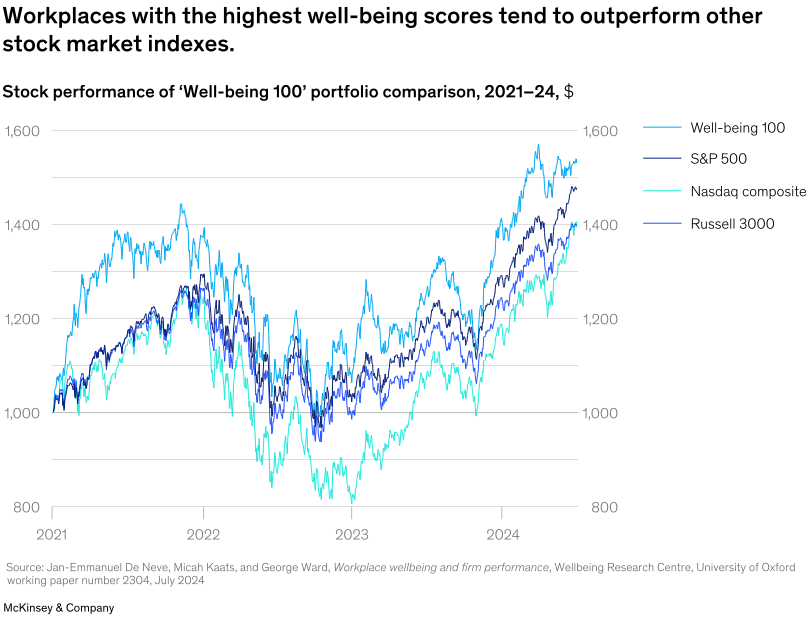
February 19, 2025 – Prioritizing employee health is good for business. Senior Partner Brooke Weddle and coauthors examined a “Well-being 100” portfolio, made up of 100 companies with the highest scores for employee well-being on the job-seeking website Indeed. They explain that this portfolio outperformed major market indexes, including the S&P 500, Nasdaq composite, and Russell 3000, between 2021 and 2024.
To read the report, see “Thriving workplaces: How employers can improve productivity and change lives,” January 16, 2025.
customizer here
Visual form
Line Chart: four-series portfolio-value comparison for the Well-being 100 and major market indexes.
Layout / body structure
The chart uses one shared time axis from 2021 to 2024 and four colored lines. The legend identifies the Well-being 100, S&P 500, Nasdaq composite, and Russell 3000.
What is being compared
It compares the performance of a Well-being 100 portfolio with three broad stock market indexes across the same market cycle.
Measurement system
The vertical scale is portfolio value in dollars, running roughly from 800 to 1,600. Each line shows the value path of one portfolio or index over time.
Visible structure inside the graphic
All four lines dip during the 2022 downturn and then recover, but the Well-being 100 line runs above the benchmark lines for much of the period and finishes highest.
Main takeaway from the visual
The chart shows the Well-being 100 outperforming the major benchmarks over the period shown, supporting the connection between strong employee well-being scores and stronger market performance.
Key standout values or extremes
The Well-being 100 ends a little above 1,500, ahead of the S&P 500 in the high 1,400s and the Nasdaq composite near 1,400. The Nasdaq composite has one of the deepest troughs, falling toward the low 800s before recovering.
Controls / sequence, when applicable
This is a fixed multi-line chart; there are no in-chart controls to operate.
Companion media, when applicable
There is no separate companion audio or video; the workplace well-being stock-performance line chart is the visual on this page.