Source page: McKinsey & Company
Commentary
Trade policy tensions
Geopolitics | Global Trade
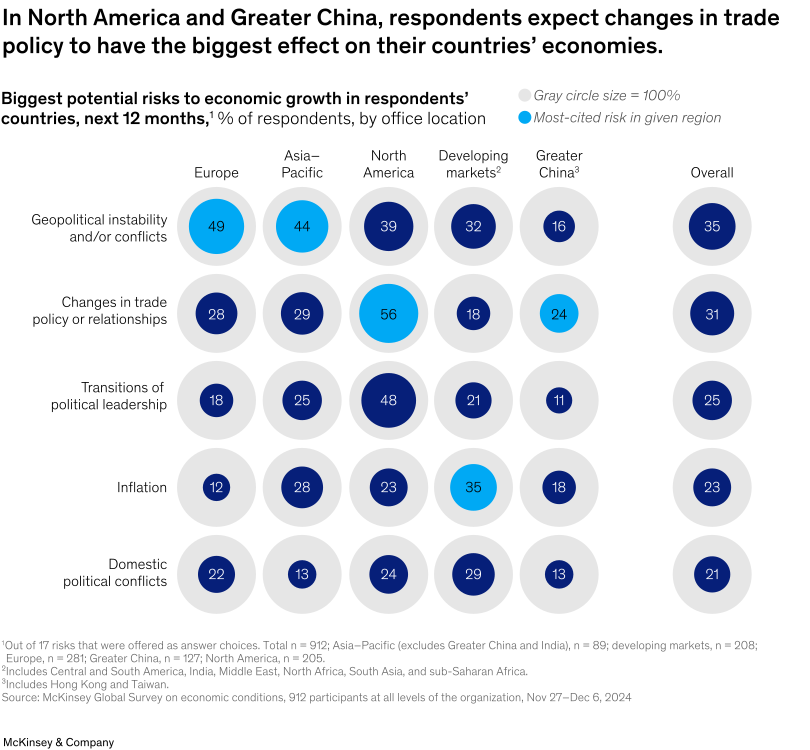
January 14, 2025 – Trade policy changes were most often cited by executives in Greater China and North America as the greatest risk to their economies in the coming year, according to a recent McKinsey Global Survey. It marks the first time since fall 2019 that changes to trade policy reached the top five most-cited issues among surveyed executives. Respondents in Asia–Pacific and Europe have geopolitical instability at the top of their list of concerns, senior partner Sven Smit and colleagues note.
To read the survey, see “Economic conditions outlook, December 2024,” December 20, 2024.
customizer here
Visual form
Table (with Visual Encoding): proportional-circle risk matrix by region and economic-growth threat.
Layout / body structure
Risk types form the rows, and respondent office locations form the columns. Each cell uses a circle and percentage label to show how often that risk was selected in that region.
What is being compared
It compares perceived risks to economic growth across Europe, Asia-Pacific, North America, developing markets, Greater China, and the overall sample.
Measurement system
Each cell is percent of respondents. Circle size reinforces the printed percentage, and highlighted blue circles identify the top risk within a region.
Visible structure inside the graphic
The matrix makes the leading risk in each column visible through blue highlights. Trade policy stands out in North America and Greater China, while geopolitical instability leads in Europe and Asia-Pacific.
Main takeaway from the visual
The chart shows that trade policy became the top perceived risk in North America and Greater China, while geopolitical conflict remained the leading risk in several other regions.
Key standout values or extremes
North America reaches 56 percent for changes in trade policy or relationships. Europe reaches 49 percent and Asia-Pacific reaches 44 percent for geopolitical instability and conflict, while Greater China shows trade policy as its top risk at 24 percent.
Controls / sequence, when applicable
This is a fixed proportional-circle matrix; there are no in-chart controls to operate.
Companion media, when applicable
There is no separate companion audio or video; the regional risk matrix is the visual on this page.