Source page: McKinsey & Company
Commentary
Healthcare’s rough ride
Healthcare | Growth
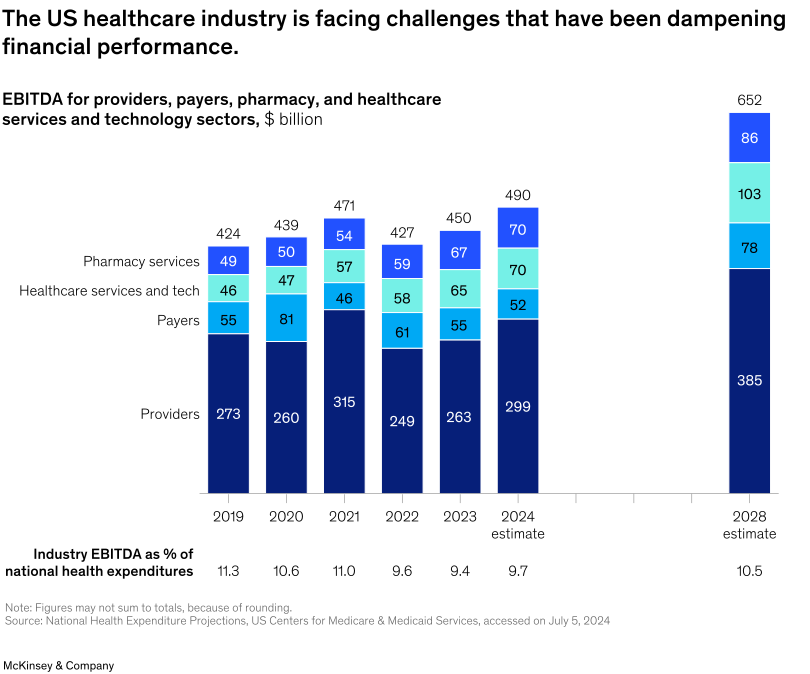
January 9, 2025 – In recent years, healthcare businesses have come under heightened pressure, dampening their financial performance. Provider organizations’ were the first to see their EBITDA performance hit hard, starting in 2022, say senior partner Shubham Singhal and coauthors. Payers were initially sheltered, but 2023 brought increased hurdles. The pharmacy services sector experienced mixed outcomes: some organizations thrived due to pharmaceutical innovation and new delivery models, while others struggled with intensified regulatory scrutiny. In contrast, the healthcare services and technology segment has steadily grown, driven by demand for data, analytics, and software.
To read the article, see “How the healthcare industry can weather ongoing challenges,” December 5, 2024.
customizer here
Visual form
Stacked column chart across time.
Layout / body structure
The visual is a sequence of annual stacked columns from 2019 through the 2024 estimate, followed by a separated 2028 estimate column on the far right. Read left to right to follow total EBITDA and the mix among providers, payers, healthcare services and tech, and pharmacy services, then use the row beneath to compare EBITDA as a share of national health expenditures.
What is being compared
It compares EBITDA across four healthcare sectors over time and also compares the industry total as a share of national health expenditures. The stacked design shows how the mix and total level evolve through the recent rough period and into the 2028 estimate.
Measurement system
The columns are measured in billions of dollars, with totals labeled at the top of each stack and segment values printed inside the components. A second row beneath the chart reports EBITDA as a percentage of national health expenditures for each year.
Visible structure inside the graphic
The chart is built from stacked annual columns with the providers segment as the dominant base and smaller segments layered above for payers, healthcare services and tech, and pharmacy services. A large gap precedes the 2028 estimate, visually separating the forward view from the recent annual history.
Main takeaway from the visual
The chart shows that healthcare financial performance has been pressured in the recent period even though absolute EBITDA remains large. Totals fluctuate and the EBITDA share of national health expenditures falls from earlier levels before only a modest rebound in the 2028 estimate.
Key standout values or extremes
Total EBITDA moves from 424 billion dollars in 2019 to 471 in 2021, then dips to 427 in 2022 before recovering to an estimated 490 in 2024 and 652 by 2028. Providers remain the largest segment throughout, falling from 315 in 2021 to 249 in 2022 before recovering, while EBITDA as a share of national health expenditures drops from 11.3 percent in 2019 to 9.4 percent in 2023 and only reaches 10.5 percent in the 2028 estimate.
Controls / sequence, when applicable
This is a static chart image with no in-chart controls to operate.
Companion media, when applicable
There is no separate companion audio or video; the chart image is the full visual on this page.