Source page: McKinsey & Company
Commentary
The sun rises on renewables
Renewable energy | Electric power and natural gas
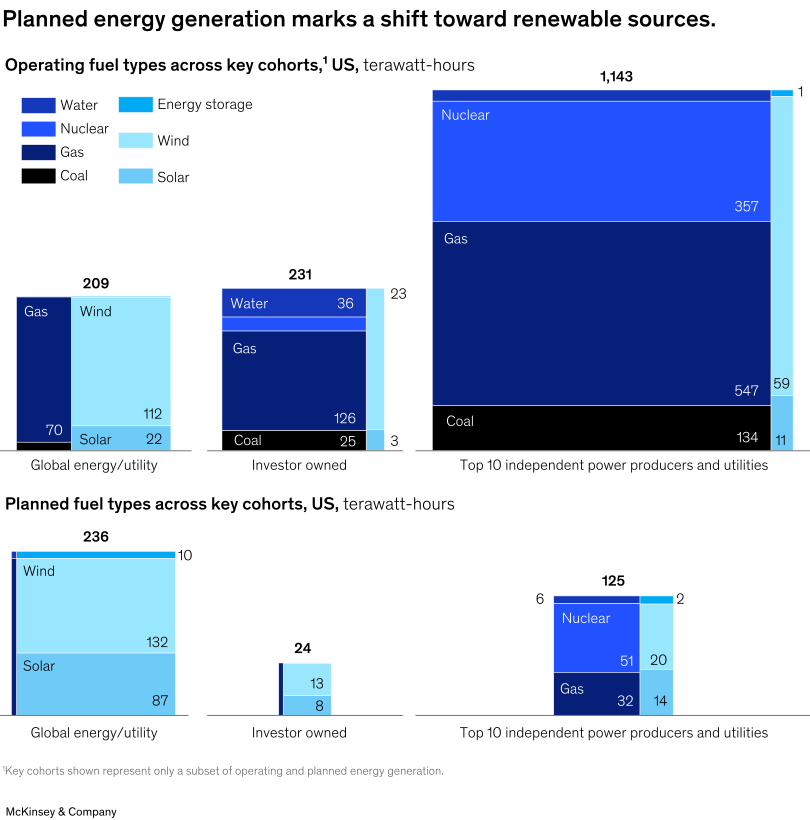
January 7, 2025 – Planned energy generation in the United States reveals a notable shift toward new players and renewable sources. Incumbents—domestic utilities, traditional-generation independent power producers, and private investors—represent about 86 percent of today’s generation. Their portfolios are primarily gas, coal, nuclear, and hydropower, according to partner Andrew Warrell and coauthors. In contrast, planned energy is dominated by industry challengers—and most of what is planned is solar, wind, and energy storage.
To read the article, see “Managing risk in renewable-energy portfolios: The role of flexible assets,” November 5, 2024.
customizer here
Visual form
Stacked Bar / Stacked Column: operating-versus-planned generation mix by power-company cohort.
Layout / body structure
The chart is split into an upper operating-generation section and a lower planned-generation section. Each section repeats three cohort columns for global energy and utility, investor-owned utilities, and the top 10 independent power producers and utilities.
What is being compared
It compares current and planned generation mixes by fuel type, including water, nuclear, gas, coal, energy storage, wind, and solar.
Measurement system
Values are terawatt-hours. Totals appear above each stacked block, and segment labels show the contribution of individual fuel types.
Visible structure inside the graphic
The upper stacks are larger and more weighted toward gas, coal, and nuclear. The lower planned-generation stacks are smaller but much more concentrated in solar, wind, storage, and other renewable-oriented segments.
Main takeaway from the visual
The chart shows a clear pipeline shift: today’s operating generation is still fossil- and nuclear-heavy, while planned generation tilts much more toward renewables and flexible assets.
Key standout values or extremes
The top 10 independent power producers and utilities have the largest operating total at 1,143 terawatt-hours, including 547 from gas, 357 from nuclear, and 134 from coal. In planned generation, the global energy and utility cohort totals 236 terawatt-hours, led by 132 of wind and 87 of solar.
Controls / sequence, when applicable
This is a fixed stacked-column chart; there are no in-chart controls to operate.
Companion media, when applicable
There is no separate companion audio or video; the operating-versus-planned generation stacked chart is the visual on this page.