Source page: McKinsey & Company
Commentary
Europe’s power in play
Electric power and natural gas | Europe | Energy
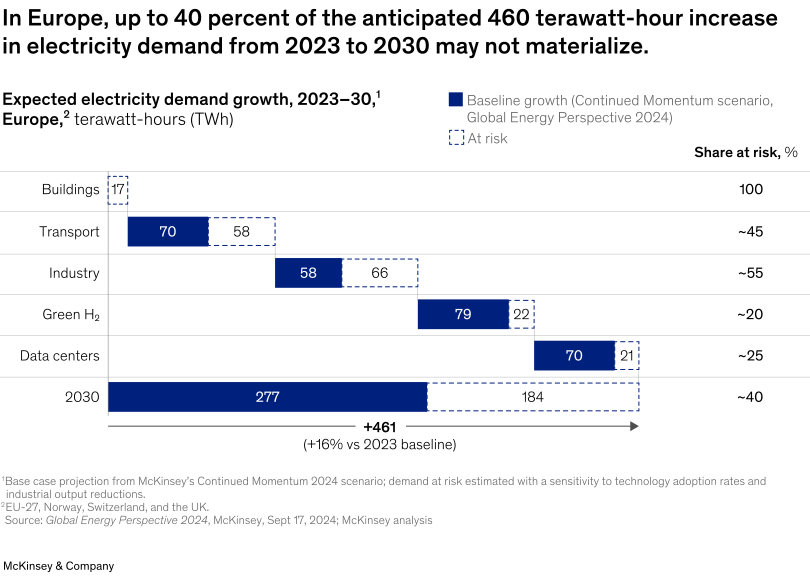
December 17, 2024 – Power demand in Europe was projected to grow by 460 terawatt-hours between 2023 and 2030 because of rising GDP and population growth—but new analysis suggests up to 40 percent of this power demand might not occur. Senior partner Alexander Weiss and coauthors find that elevated power prices, energy efficiency gains, and structural economic changes linked to deindustrialization may moderate energy demand growth. Demand for energy to power data centers and green hydrogen production is the least at risk, while industry, transport, and buildings have the largest share of their power demands at risk of not materializing.
To read the article, see “Electricity demand in Europe: Growing or going?,” October 24, 2024.
customizer here
Visual form
Horizontal segmented bar chart with a total bar at the bottom.
Layout / body structure
The visual is arranged as a short ranked list of demand sources, each shown as a bar split into baseline growth and demand at risk, with a total 2030 bar beneath them. Read the rows from top to bottom, then use the far-right share-at-risk column and the bottom total bar to compare how each demand source contributes to the full increase.
What is being compared
It compares the expected increase in European electricity demand from 2023 to 2030 across buildings, transport, industry, green hydrogen, and data centers. Within each row it also compares the baseline demand-growth portion against the share considered at risk of not materializing.
Measurement system
The bars are measured in terawatt-hours, and the rightmost labels show the share at risk as a percentage. Solid dark-blue segments represent baseline growth, while dashed-outline segments represent the at-risk portion.
Visible structure inside the graphic
Each sector row is a horizontal bar split into a filled base segment and a dashed outlined extension for the at-risk component. The bottom row sums the pieces into a 2030 total bar, with a long arrow beneath it calling out the aggregate increase versus the 2023 baseline.
Main takeaway from the visual
The chart shows that Europe may fall materially short of the headline electricity-demand increase that is often assumed for 2030. A substantial share of the projected gain appears in dashed at-risk segments, making the shortfall especially visible in transport and industry and then again in the summed total.
Key standout values or extremes
The total 2030 increase is shown at about 461 terawatt-hours, made up of 277 terawatt-hours of baseline growth and 184 terawatt-hours at risk, which implies roughly 40 percent may not materialize. Buildings are shown as entirely at risk at 17 terawatt-hours, transport carries about 70 baseline plus 58 at risk, industry about 58 baseline plus 66 at risk, green hydrogen about 79 baseline plus 22 at risk, and data centers about 70 baseline plus 21 at risk.
Controls / sequence, when applicable
This is a static chart image with no in-chart controls to operate.
Companion media, when applicable
There is no separate companion audio or video; the chart image is the full visual on this page.