Source page: McKinsey & Company
Commentary
Billion-dollar disasters on the rise
Electric power and natural gas | Energy
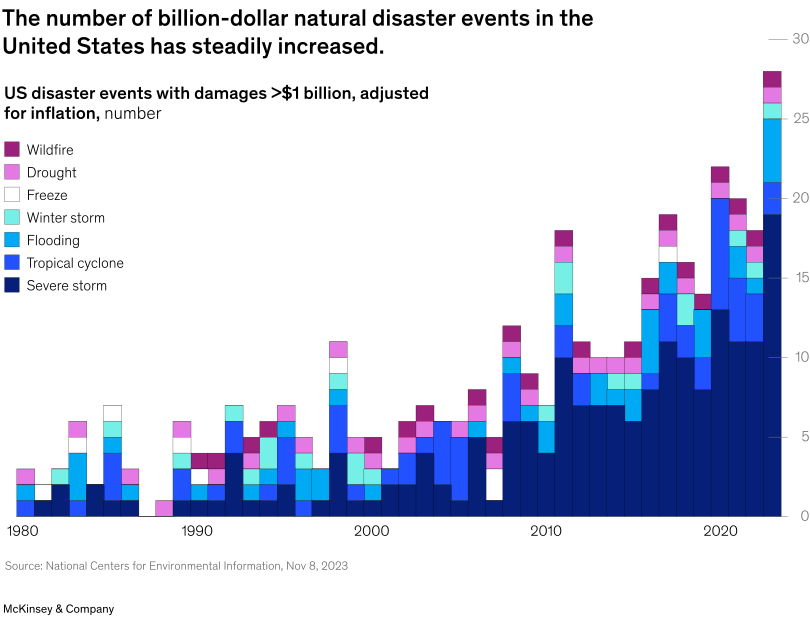
December 10, 2024 – An uptick in extreme weather events is one reason why North American power and gas companies may need to manage risk differently. Weather-related events have become more frequent in recent decades, and the resulting damage comes with hefty price tags, partner Roland Rechtsteiner and coauthors note. There were 97 natural disasters between 1984 and 2003 that cost more than $1 billion. From 2004 to 2023, that number rose to 273. Extreme weather events can affect demand for utilities, threaten aging infrastructure, and result in volatile fuel costs.
To read the article, see “Unlocking value from power and natural gas trading in North America,” November 5, 2024.
customizer here
Visual form
Stacked annual column chart.
Layout / body structure
The chart is a single time-series chart running from 1980 through the early 2020s, with each year shown as a stacked column by disaster type. Read left to right across the years, then compare the changing total column heights and the shifting composition of the stacks.
What is being compared
It compares the annual number of US natural-disaster events causing more than 1 billion dollars in inflation-adjusted damages. The stacked colors separate severe storm, tropical cyclone, flooding, winter storm, freeze, drought, and wildfire.
Measurement system
The vertical axis measures the number of billion-dollar events, and the horizontal axis is calendar year. The legend identifies the colored disaster categories that build each annual total.
Visible structure inside the graphic
Each year is a stacked bar, with the dark severe-storm base carrying much of the total in later years and smaller colored segments layered above for the other hazards. The columns start relatively low in the 1980s and 1990s and then become taller and more crowded in the 2010s and early 2020s.
Main takeaway from the visual
The chart shows a clear upward trend in the number of costly US disaster events over time. Later years contain many more and much taller stacks than the early decades, and severe storms account for a large share of that rise even as other hazard categories continue to contribute.
Key standout values or extremes
The annual totals remain mostly in the low single digits in the early 1980s but climb into the teens and then above 20 in multiple recent years. The highest recent bar reaches the upper 20s, and the dark severe-storm segment forms the largest portion of many of the tallest stacks in the late 2010s and early 2020s.
Controls / sequence, when applicable
This is a static chart image with no in-chart controls to operate.
Companion media, when applicable
There is no separate companion audio or video; the chart image is the full visual on this page.