Source page: McKinsey & Company
Commentary
The insurance allure
Private equity | Financial services
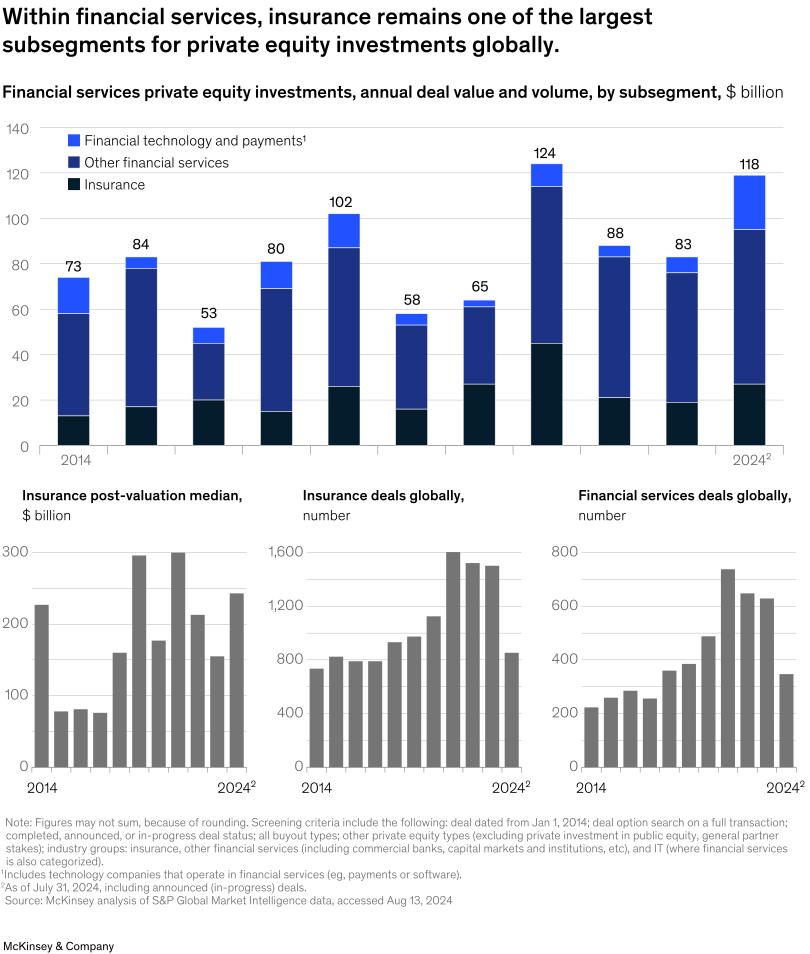
December 4, 2024 – Private equity has consistently invested in the insurance sector, which has established itself as a key subsegment of financial services, particularly commercial lines. And it’s continuing to grow, partner Grier Tumas Dienstag and colleagues say. At the start of the third quarter 2024, the value of insurance deals surpassed that of 2022 and 2023 and occurred alongside an uptick in investments in financial technology and broader financial services.
To read the article, see “Investing in insurance: The value imperative,” October 14, 2024.
customizer here
Visual form
Mixed chart with a stacked column chart above three small bar charts.
Layout / body structure
The visual has one large top panel and three smaller bottom panels. Read the top panel first for annual financial-services private-equity investment value by subsegment, then move left to right across the lower row to compare insurance post-valuation median, global insurance deal count, and total financial-services deal count.
What is being compared
It compares private-equity investment value in insurance against other financial-services subsegments over time, and it also compares insurance valuation and deal volume against broader financial-services deal activity. The layout is designed to show both the size of insurance within the market and how active the subsector remains across multiple deal measures.
Measurement system
The top panel is measured in billions of dollars, while the bottom panels use billions of dollars for valuation median and number of deals for the two volume charts. Color distinguishes insurance, other financial services, and financial technology and payments in the top stacked columns.
Visible structure inside the graphic
The upper chart is a sequence of stacked annual bars labeled with total deal value, and the lower row consists of three simple gray bar charts that each track a different insurance or financial-services measure over time. Together they connect subsector composition, valuation, and deal activity in one chart.
Main takeaway from the visual
The visual shows that insurance remains a major destination for private-equity capital within financial services and continues to post meaningful deal activity even as yearly totals move around. The insurance layer stays substantial in the top stack and the supporting lower panels show persistent deal counts and strong valuation periods.
Key standout values or extremes
Total financial-services private-equity investment rises to 124 billion dollars in one peak year and still reaches 118 billion dollars in 2024, with insurance forming a significant share of those stacks. In the lower panels, insurance deals globally climb as high as about 1,600, financial-services deals globally peak above 700, and insurance post-valuation median reaches roughly 300 billion dollars at its high points before easing back toward the mid-200s.
Controls / sequence, when applicable
This is a static chart image with no in-chart controls to operate.
Companion media, when applicable
There is no separate companion audio or video; the chart image is the full visual on this page.