Source page: McKinsey & Company
Commentary
A big business bite for digital and AI
Generative AI | Food | Consumer
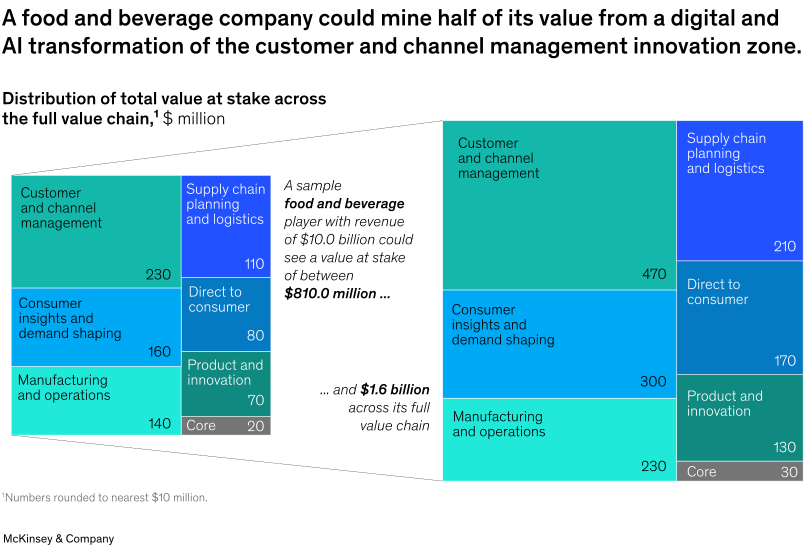
November 26, 2024 – Food and beverage companies could unlock significant value with digital and AI transformations. Senior partner Jessica Moulton and colleagues find that a sample food and beverage company with $10 billion in revenue could realize between $810 million and $1.6 billion in potential value from a digital and AI transformation across its full value chain. Customer and channel management could provide nearly half this value. Retail trade promotions, which can account for as much as 20 percent of revenue for a food and beverage company, are particularly ripe for digital and analytics optimization.
To read the article, see “Fortune or fiction? The real value of a digital and AI transformation in CPG,” October 3, 2024.
customizer here
Visual form
Treemap-style value-at-stake chart.
Layout / body structure
The chart is split into two treemap blocks with a zoom-like transition from a sample company on the left to the full value chain on the right. Read the smaller left block first to see the sample food and beverage player, then read the larger right block to see how the same value pools scale across the full value chain.
What is being compared
It compares the distribution of value at stake across a food and beverage company and then across its full value chain. The categories include customer and channel management, supply chain planning and logistics, consumer insights and demand shaping, direct to consumer, manufacturing and operations, product and innovation, and core.
Measurement system
The blocks are measured in millions of dollars. Area size and the numeric labels inside the rectangles indicate the relative contribution of each innovation zone to the total value at stake.
Visible structure inside the graphic
The visual is organized as nested rectangles of different sizes, with each rectangle representing a value pool. The same category structure appears in both the sample-company block and the expanded full-value-chain block, making it easy to compare how the ranking and proportions hold when the scale increases.
Main takeaway from the visual
The chart shows that customer and channel management is the largest source of value at stake and that digital and AI transformation in this zone drives a large share of the total opportunity. In both treemap blocks, the customer-and-channel rectangle is the largest tile on the page.
Key standout values or extremes
For the sample company, customer and channel management is labeled at 230 million dollars, ahead of consumer insights and demand shaping at 160 million and manufacturing and operations at 140 million. Across the full value chain, customer and channel management rises to 470 million dollars within a total value at stake of about 1.6 billion dollars, while consumer insights and demand shaping reaches 300 million and supply chain planning and logistics 210 million.
Controls / sequence, when applicable
This is a static chart image with no in-chart controls to operate.
Companion media, when applicable
There is no separate companion audio or video; the chart image is the full visual on this page.