Source page: McKinsey & Company
Commentary
A transatlantic AI divide
Artificial Intelligence | Generative AI | Europe
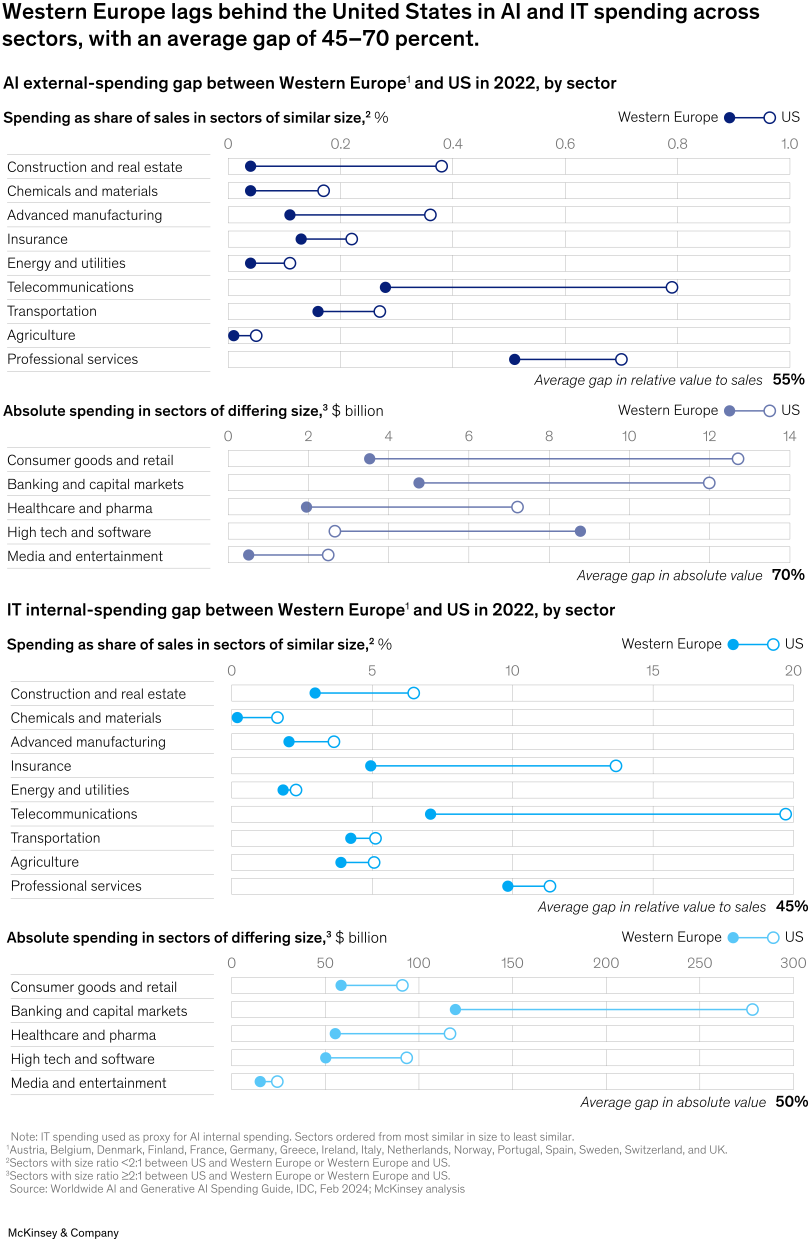
November 21, 2024 – AI opportunities abound for European companies, but they have some ground to make up on their US counterparts. Western European companies in 2022 spent less on AI and IT than their US counterparts across nearly all sectors, from consumer goods to construction, senior partner Alexander Sukharevsky and coauthors explain. Overall, US companies outspent Western European companies by 45 to 70 percent, a disparity that could erode European competitiveness over time.
To read the article, see “Time to place our bets: Europe’s AI opportunity,” October 1, 2024.
customizer here
Visual form
Multi-panel dumbbell comparison chart.
Layout / body structure
The chart is arranged as four stacked sections, each listing sectors down the page and comparing Western Europe to the United States on a shared horizontal scale. Read each section left to right across the line connecting the two endpoints, then move down the sector rows and through the four sections from AI external spending to IT internal spending.
What is being compared
It compares Western Europe and the United States on AI external spending and IT internal spending, using both spending as a share of sales in similarly sized sectors and absolute spending in sectors of differing size. The sectors span construction and real estate, chemicals and materials, advanced manufacturing, insurance, energy and utilities, telecommunications, transportation, agriculture, professional services, consumer goods and retail, banking and capital markets, healthcare and pharma, high tech and software, and media and entertainment.
Measurement system
The horizontal scales use percentages of sales in the relative-spend sections and billions of dollars in the absolute-spend sections. Each row is a dumbbell, with one endpoint for Western Europe and one for the US, and summary annotations at the right report average percentage gaps.
Visible structure inside the graphic
Each section is a set of paired dots connected by a line segment, making the size of the transatlantic gap visible row by row. The chart repeats this same structure across AI external relative spend, AI external absolute spend, IT internal relative spend, and IT internal absolute spend, so the reader can compare both the consistency and the size of the gap across measures.
Main takeaway from the visual
The visual shows that Western Europe trails the United States in AI and IT spending across most sectors and on both relative and absolute measures. In almost every row, the US endpoint sits to the right of the Western Europe endpoint, and the summary labels reinforce that the average gaps are material rather than isolated.
Key standout values or extremes
The chart labels an average AI external-spending gap of about 55 percent on a relative-to-sales basis and about 70 percent on an absolute basis, while the IT internal-spending gap is about 45 percent on a relative basis and 50 percent on an absolute basis. Telecommunications shows one of the most stretched relative gaps in both AI external and IT internal spending, and banking and capital markets shows one of the largest absolute IT internal-spending gaps.
Controls / sequence, when applicable
This is a static chart image with no in-chart controls to operate.
Companion media, when applicable
There is no separate companion audio or video; the chart image is the full visual on this page.