Source page: McKinsey & Company
Commentary
Emerging energy demands
Economic Development | Energy
November 12, 2024 – COP29—or the Conference of the Parties, which is the UN’s summit to accelerate global action to address climate change—is under way through November 22 in Baku, Azerbaijan. All this week, our data visualizations will focus on key climate themes, including global energy needs, sustainable commodities, and ongoing fossil fuel demand. For more, see “McKinsey at COP29.”
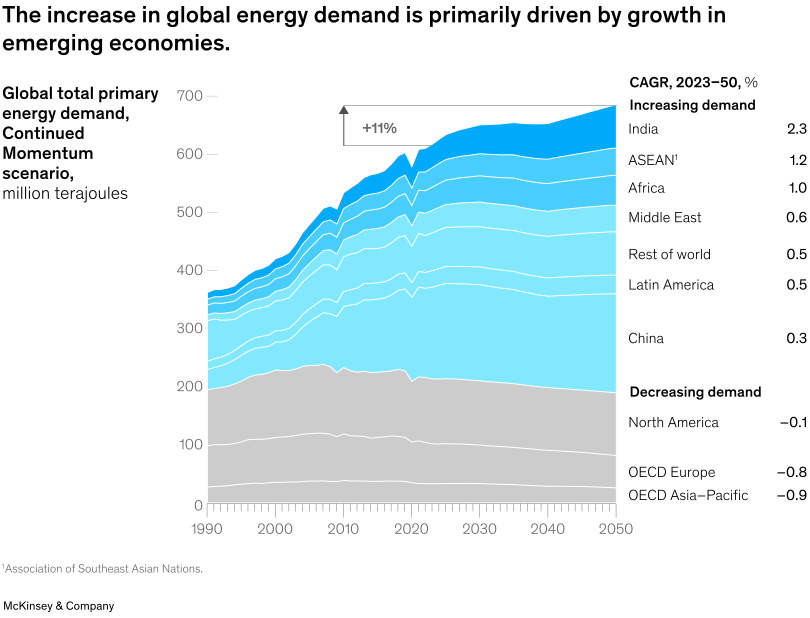
Global energy demand has taken off once again after a dip in 2020. It is projected to grow 11 percent by 2050 if momentum continues at its current pace. Most of the energy demand growth is expected in emerging economies such as the Association of Southeast Asian Nations (ASEAN), India, and the Middle East, senior partner Alessandro Agosta and colleagues note. ASEAN countries in particular are expected to propel this growth, which may reshape global energy trade flows.
To read the report, see “Global Energy Perspective 2024,” September 17, 2024.
customizer here
Visual form
Stacked area chart with a side CAGR list.
Layout / body structure
The chart is one long time-series area chart from 1990 to 2050 with a right-side list of CAGR values by region. Read the stacked areas left to right across time, then compare the right-hand regional growth list to see which segments are expanding and which are shrinking.
What is being compared
It compares global total primary energy demand by region over time under the Continued Momentum scenario. The regions include India, ASEAN, Africa, the Middle East, the rest of world, Latin America, China, North America, OECD Europe, and OECD Asia-Pacific.
Measurement system
The vertical axis is measured in million terajoules, and the right-hand list reports CAGR percentages for 2023 to 2050. Each colored area represents one regional contribution to the global total, and the top boundary of the stacked area traces the total demand level over time.
Visible structure inside the graphic
The chart is built from layered regional bands stacked on top of one another, with the emerging-economy bands in blue tones placed above a base of flatter or declining gray OECD bands. The right-side text list separates increasing-demand regions from decreasing-demand regions to mirror what the stacked areas show visually.
Main takeaway from the visual
The visual shows that global energy demand keeps rising overall, but that growth is driven primarily by emerging economies while several advanced regions decline. The upper blue layers expand over time, whereas the gray OECD layers flatten or contract toward 2050.
Key standout values or extremes
The chart calls out an overall increase of about 11 percent from the 2023 level to 2050. On the CAGR list, India leads at 2.3 percent, followed by ASEAN at 1.2 percent and Africa at 1.0 percent, while North America declines at -0.1 percent, OECD Europe at -0.8 percent, and OECD Asia-Pacific at -0.9 percent.
Controls / sequence, when applicable
This is a static chart image with no in-chart controls to operate.
Companion media, when applicable
There is no separate companion audio or video; the chart image is the full visual on this page.