Source page: McKinsey & Company
Commentary
The retailer shuffle
Retail | Strategy
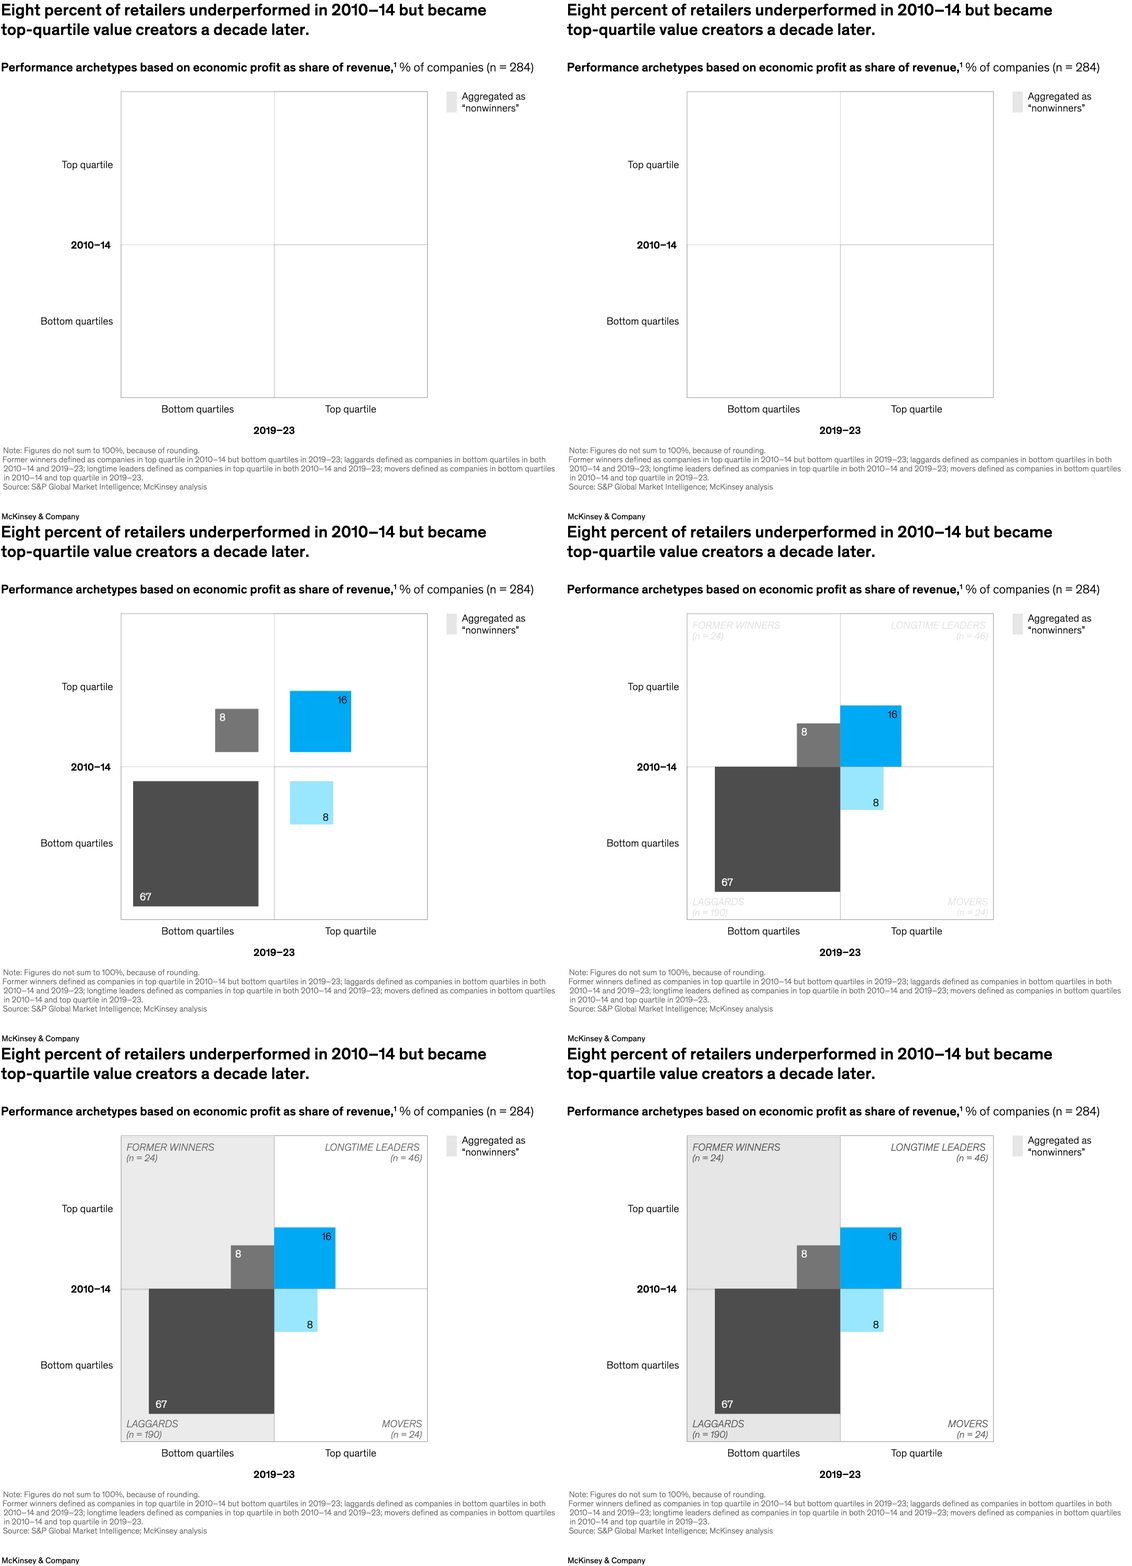
October 17, 2024 – While large companies tend to have the upper hand in retail performance, size doesn’t always matter. Analysis of economic profit relative to revenue measures success independent of size, say senior partner Becca Coggins and colleagues. Through this lens, just 16 percent of retailers have been longtime leaders in value creation. But 8 percent of companies that were “laggards” from 2010 to 2014 managed to become top-quartile value creators in the following decade. These “movers” were significantly more likely than “nonwinners” to improve their performance in at least two of these dimensions: operating margin—specifically, cost of goods sold and SG&A ratios—growth, and capital efficiency.
To read the article, see “Retail’s outperformers: Lessons in value creation,” September 3, 2024.
customizer here
Visual form
Quadrant matrix.
Layout / body structure
The chart is a single two-axis matrix divided into four quadrants. It is read left to right across later-period performance and top to bottom across earlier-period performance, with each quadrant named and labeled inside the plot.
What is being compared
It compares retailers’ value-creation standing across two periods, separating companies that were in the top quartile or lower quartiles in 2010 – 14 from where they landed in 2019 – 23.
Measurement system
The axes are categorical rather than continuous: each side marks top-quartile versus bottom-quartile performance for one time period. Inside the quadrants, the chart shows labeled shares and group sizes, including n-counts for former winners, longtime leaders, laggards, and movers.
Visible structure inside the graphic
The matrix uses four clearly bounded fields: former winners in the upper left, longtime leaders in the upper right, laggards in the lower left, and movers in the lower right. Large numbers inside the quadrants give the visible share of the sample in each bucket, while the quadrant titles explain the transition story.
Main takeaway from the visual
Most retailers did not change competitive position: the largest share remains in the laggard quadrant, while a smaller but still notable group stayed in the leader quadrant. The chart shows movement upward and downward, but the visual weight sits with persistence rather than wholesale reshuffling.
Key standout values or extremes
The laggard quadrant carries the biggest visible share at 67, while longtime leaders are marked at 16. Movers and former winners each show 8, and the quadrant labels show group sizes of n=190 laggards, n=46 longtime leaders, and n=24 each for movers and former winners.
Controls / sequence, when applicable
This is a static chart image with no in-chart controls to operate.
Companion media, when applicable
There is no separate companion audio or video; the chart image is the full visual on this page.