Source page: McKinsey & Company
Commentary
EV owners eyeing gas
Electric vehicles | Automotive | Mobility
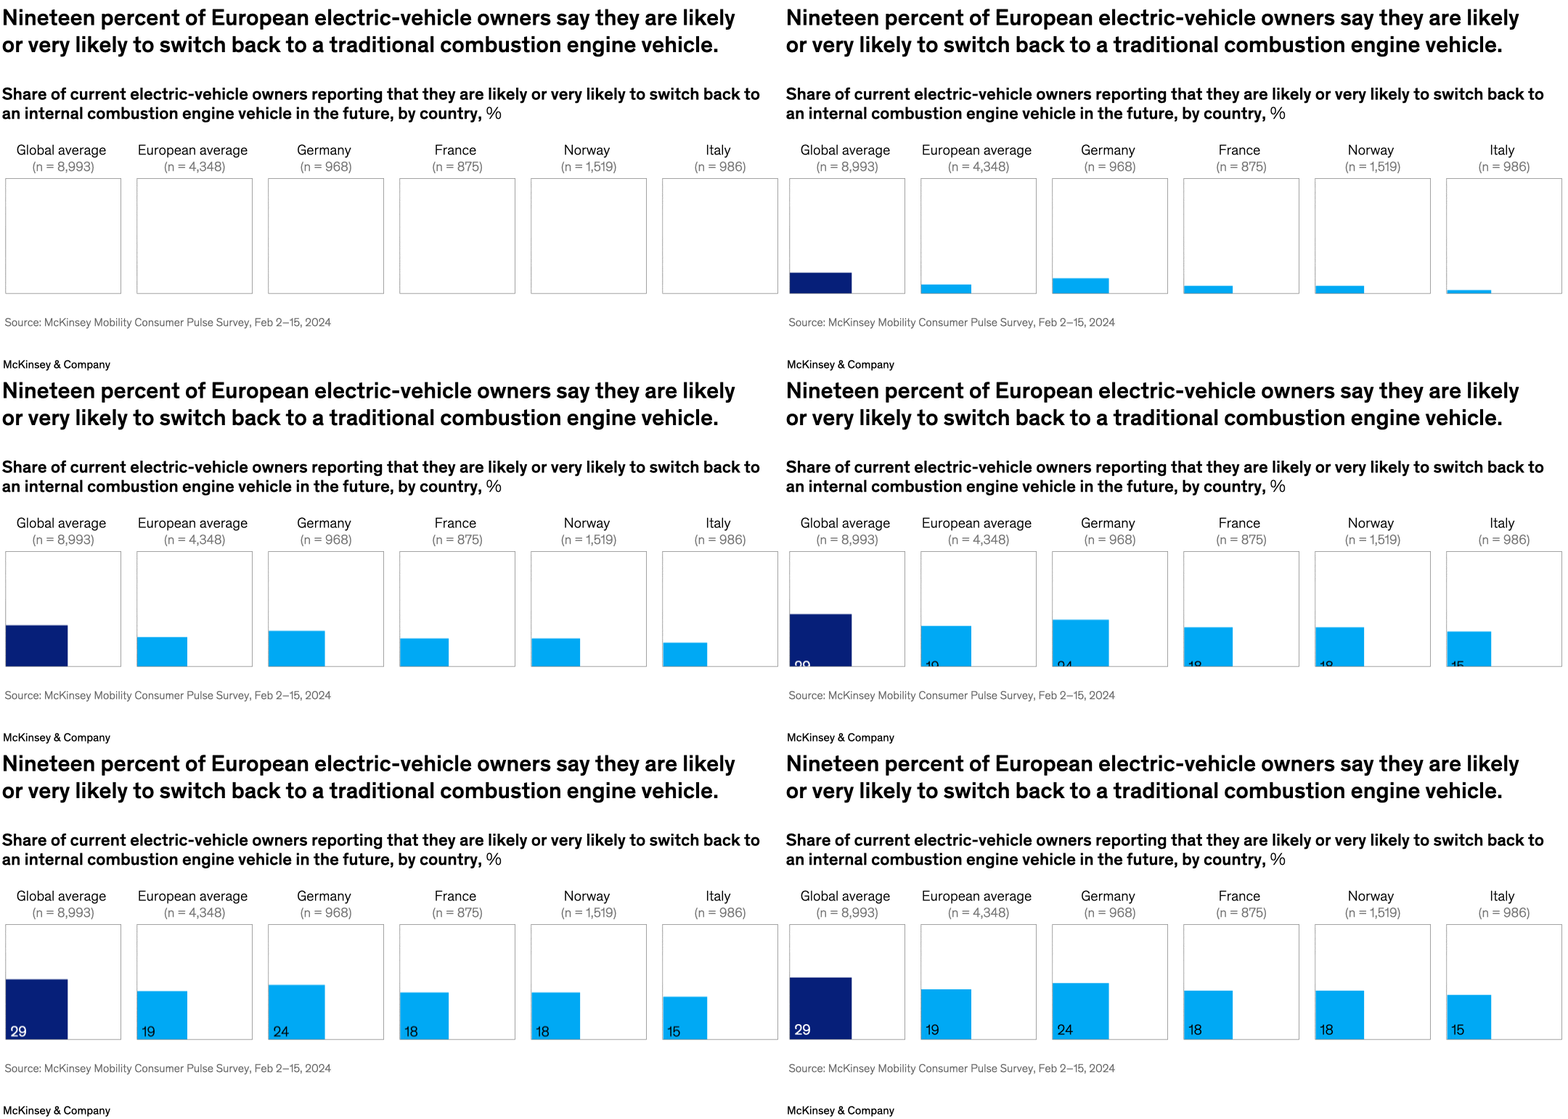
October 8, 2024 – Across Europe, 19 percent of electric vehicle owners are likely or very likely to switch back to a traditional combustion engine vehicle, according to a McKinsey Mobility Consumer Pulse Survey. Senior partner Andreas Venus and colleagues explain that the share of electric-vehicle owners who say they would consider switching back varies by country: 24 percent of owners in Germany would consider switching back, compared with 18 percent of owners in France and Norway and 15 percent in Italy. The global average is 29 percent.
To read the article, see “How European consumers perceive electric vehicles,” August 5, 2024.
customizer here
Visual form
Single-series bar chart.
Layout / body structure
The chart is a single row of six vertical bars, one bar per geography. It is read left to right from the global and European averages into the country breakouts for Germany, France, Norway, and Italy.
What is being compared
It compares the share of current electric-vehicle owners who say they are likely or very likely to switch back to an internal combustion engine vehicle, first at the global and European-average level and then across major European country markets.
Measurement system
The reader tracks percentages, with the value printed directly inside each bar. Sample sizes are shown in parentheses above each geography label, and there is no separate axis because the chart relies on the labeled columns themselves.
Visible structure inside the graphic
Each geography is given a single standalone column of the same width, so the only thing changing from one panel to the next is bar height and the number printed inside it. The repeated, minimalist layout makes the ranking across markets immediate.
Main takeaway from the visual
The chart shows that a meaningful minority of EV owners are open to returning to gas-powered vehicles, with the European average still high enough to matter. Germany sits above the European average, while France and Norway are lower and Italy is the lowest of the countries shown.
Key standout values or extremes
The global average is the highest bar at 29 percent, the European average is 19 percent, Germany reaches 24 percent, France and Norway both sit at 18 percent, and Italy is lowest at 15 percent.
Controls / sequence, when applicable
This is a static chart image with no in-chart controls to operate.
Companion media, when applicable
There is no separate companion audio or video; the chart image is the full visual on this page.