Source page: McKinsey & Company
Commentary
A boost for bank deposits
Banking | Financial services
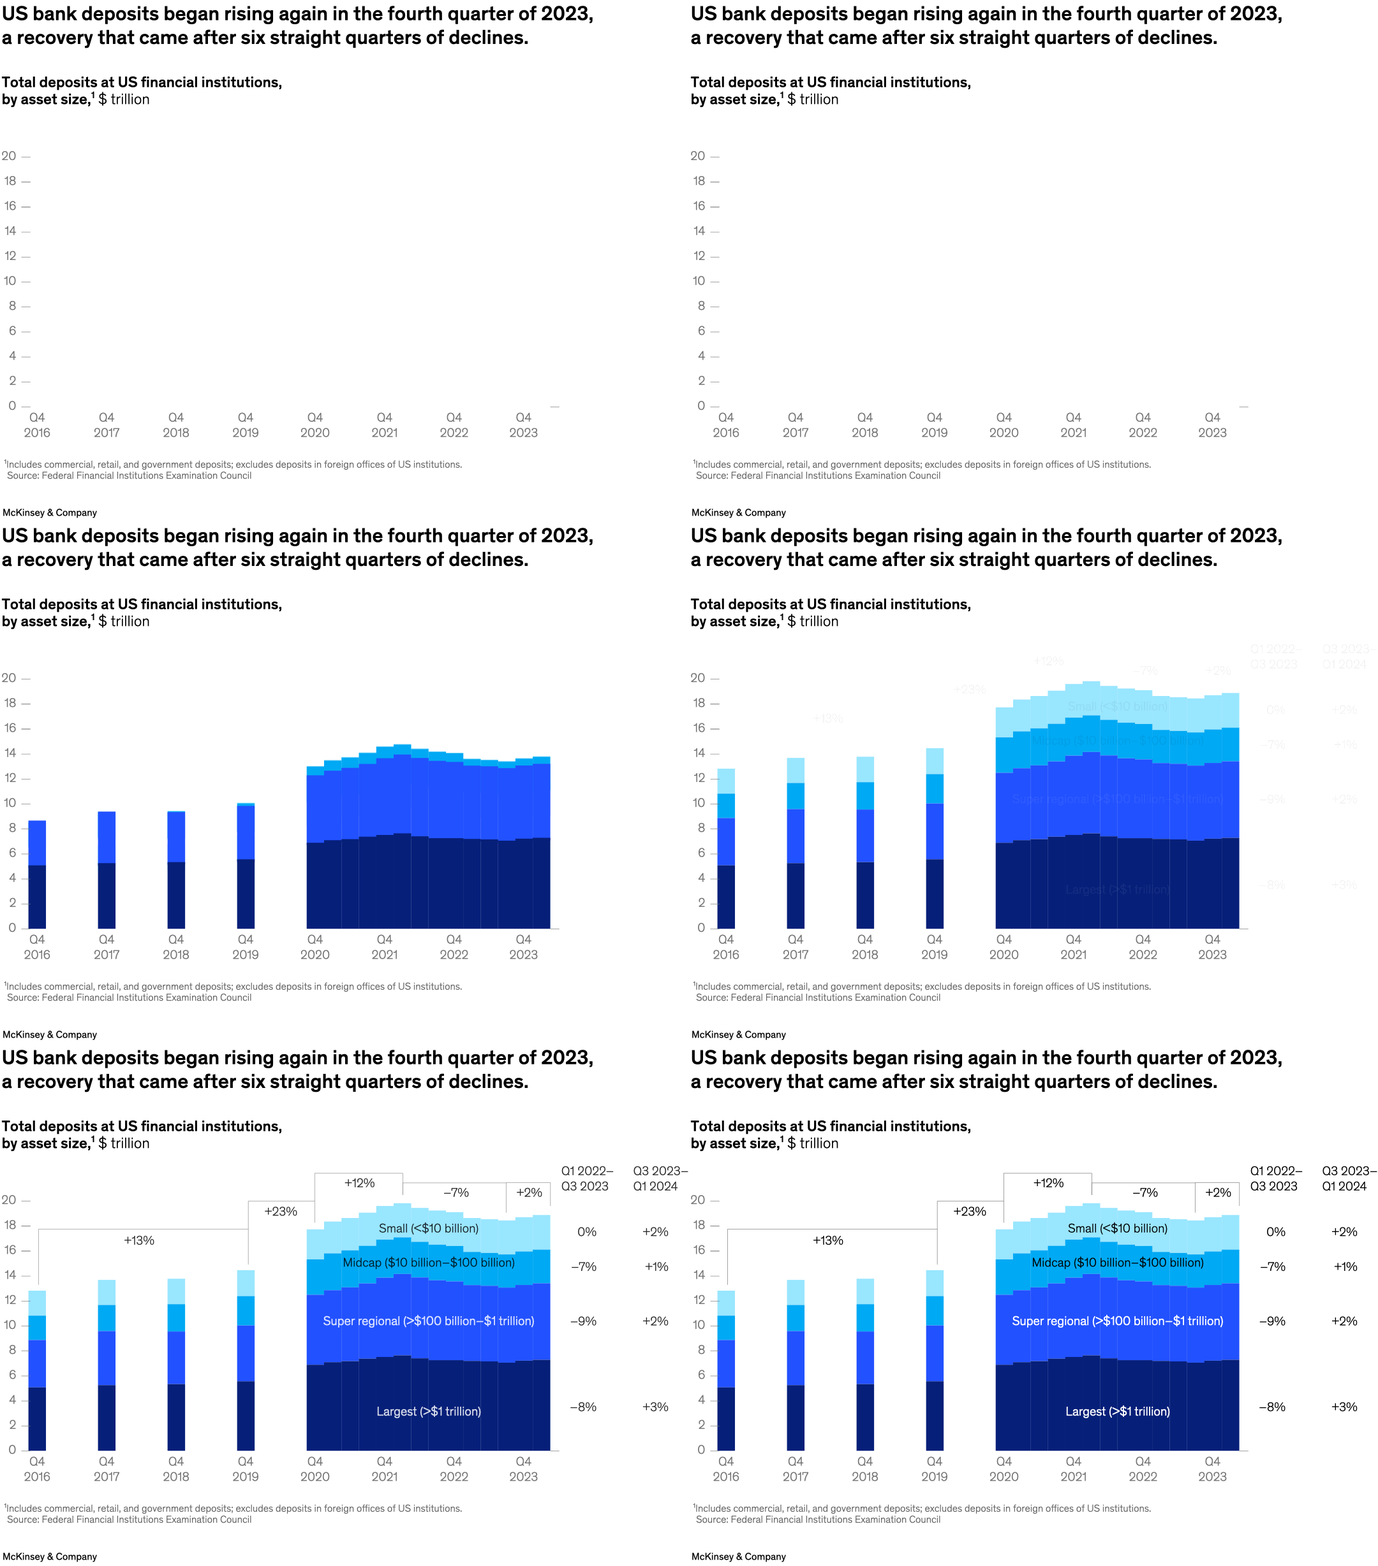
October 2, 2024 – After six consecutive quarters of declines, US bank deposits rose in the fourth quarter of 2023. The streak of declines was the result of the US Federal Reserve’s reduction of its balance sheet (known as quantitative tightening) and increase in interest rates, partner Szilard Buksa and colleagues explain. Economists expect quantitative tightening to be phased out by 2025; accordingly, banks of all asset sizes saw an increase in deposits in the fourth quarter of 2023.
To read the article, see “US banks’ commercial deposits are back on a path to growth,” August 6, 2024.
customizer here
Visual form
Stacked time-series bar chart.
Layout / body structure
The chart is a single sequence of stacked quarterly bars running from the earlier pre-2020 reference points on the left into the recent quarterly run on the right. It is read left to right across time, with deposit-size tiers stacked inside each bar and a summary table of percentage changes placed on the right edge.
What is being compared
It compares total US bank deposits over time by institution size, separating the largest banks, super regionals, midcaps, and small banks to show how the funding mix and total level changed through the downturn and rebound.
Measurement system
The reader tracks trillions of dollars on the vertical axis, while color distinguishes the four asset-size groups. The annotations above the bars and the side table summarize percentage changes across two comparison windows: Q1 2022 to Q3 2023 and Q3 2023 to Q1 2024.
Visible structure inside the graphic
Each bar is a four-layer stack, with the largest-bank segment anchoring the base and progressively smaller tiers layered above it. Brackets above the chart mark changes across multi-quarter spans, and the text labels inside the right-side bars identify the size buckets directly on the stacked columns.
Main takeaway from the visual
The visual shows deposits recovering after a prolonged slide, with the rebound arriving late in the series rather than steadily throughout it. The stacked columns dip through 2022 and 2023 and then turn back up, while the side summary shows that every size tier moved back into positive territory in the latest comparison window.
Key standout values or extremes
The chart notes a -7 percent overall decline from Q1 2022 to Q3 2023 followed by a +2 percent gain from Q3 2023 to Q1 2024. In the latest window, the largest banks rise 3 percent, super regionals rise 2 percent, midcaps rise 1 percent, and small banks rise 2 percent.
Controls / sequence, when applicable
This is a static chart image with no in-chart controls to operate.
Companion media, when applicable
There is no separate companion audio or video; the chart image is the full visual on this page.