Source page: McKinsey & Company
Commentary
Sustainable fuel flies higher
Aerospace | Sustainability
September 26, 2024 – This week, our charts feature the latest insights in aviation—from soaring fleet demands to landing the right talent and more.
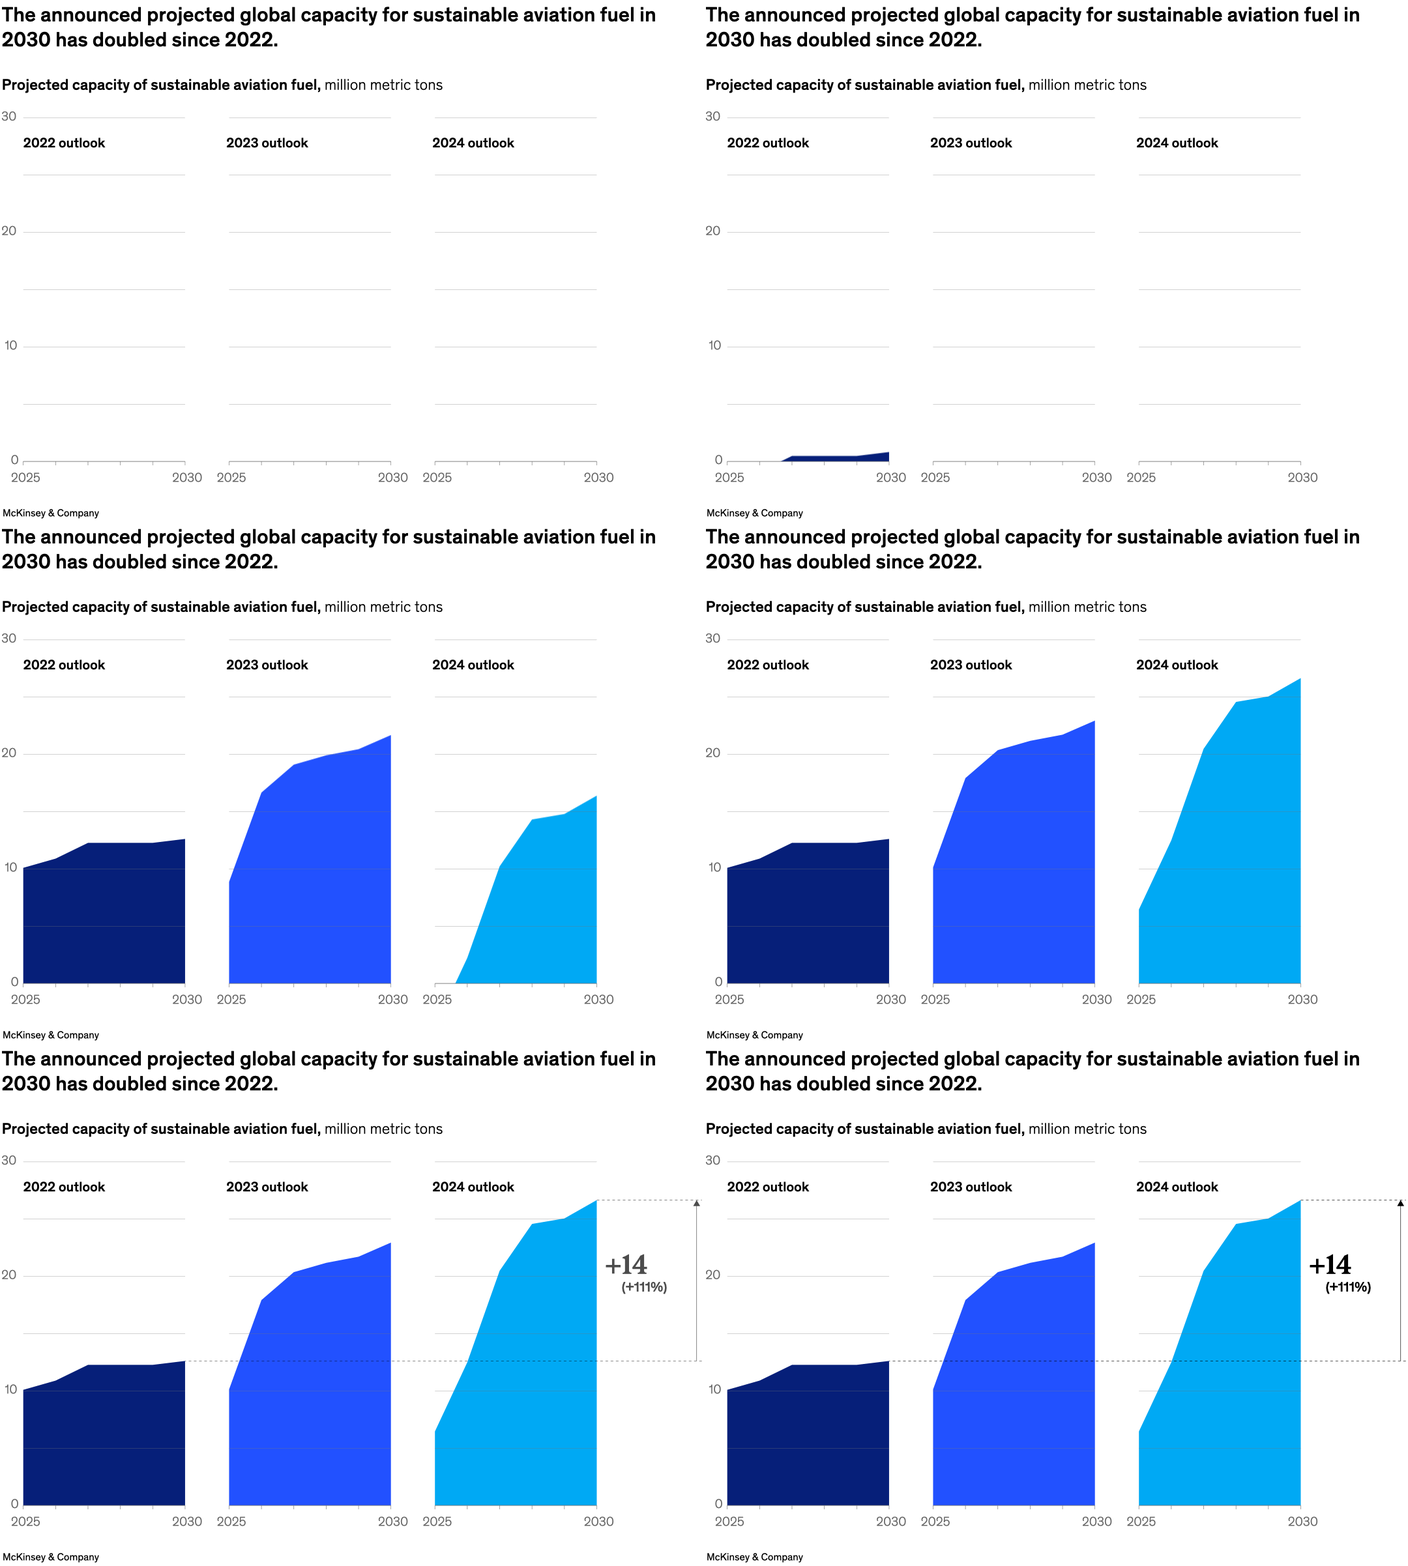
Global projections for sustainable aviation fuel capacity in 2030 have increased significantly since 2022. According to partner Axel Esqué and coauthors, the projected 2030 volume has doubled, from seven million metric tons in 2022 to 14 million metric tons this year. Although the 2030 projection is now higher, the amount of fuel expected to be available in the near future has decreased since last year’s projection.
To read the article, see “How the aviation industry could help scale sustainable fuel production,” July 22, 2024.
customizer here
Visual form
Three-panel area chart sequence.
Layout / body structure
The chart is split into three side-by-side outlook panels labeled 2022, 2023, and 2024. Each panel shows the projected path from 2025 to 2030, so the page is read left to right across forecast vintages and then within each panel from the first forecast year to the 2030 endpoint.
What is being compared
It compares successive annual outlooks for projected global sustainable aviation fuel capacity, showing how the expected 2030 capacity path has been revised upward from one forecast year to the next.
Measurement system
The reader tracks million metric tons on a shared vertical scale running up to 30. A dashed horizontal guide links the earlier 2030 outlook level to the later panel, and the right-side annotation summarizes the change between the earliest and latest outlooks.
Visible structure inside the graphic
Each panel contains a filled area that rises from the left side toward 2030. The three panels use the same shape logic and scale, so the differences come from the height of the final plateau and the steepness of the climb, with the 2024 panel visibly standing tallest.
Main takeaway from the visual
The chart shows that expected sustainable aviation fuel capacity has been revised sharply upward over a short period rather than inching up gradually. The 2024 outlook sits far above the 2022 outlook by 2030, making the acceleration in announced capacity visually unmistakable.
Key standout values or extremes
The 2022 outlook reaches a little above 12 million metric tons by 2030, the 2023 outlook climbs to roughly the low 20s, and the 2024 outlook reaches about 26. The annotation on the right calls out a gain of 14 million metric tons, or +111 percent, between the earliest and latest outlooks.
Controls / sequence, when applicable
This is a static chart image with no in-chart controls to operate.
Companion media, when applicable
There is no separate companion audio or video; the chart image is the full visual on this page.