Source page: McKinsey & Company
Commentary
Taking tech from experiment to enterprise
Cloud | Technology
September 10, 2024 – All this week, our daily charts will focus on technology trends that matter most across industries in 2024. We’ll explore tech and AI advancements, investments, talent demands, and more.
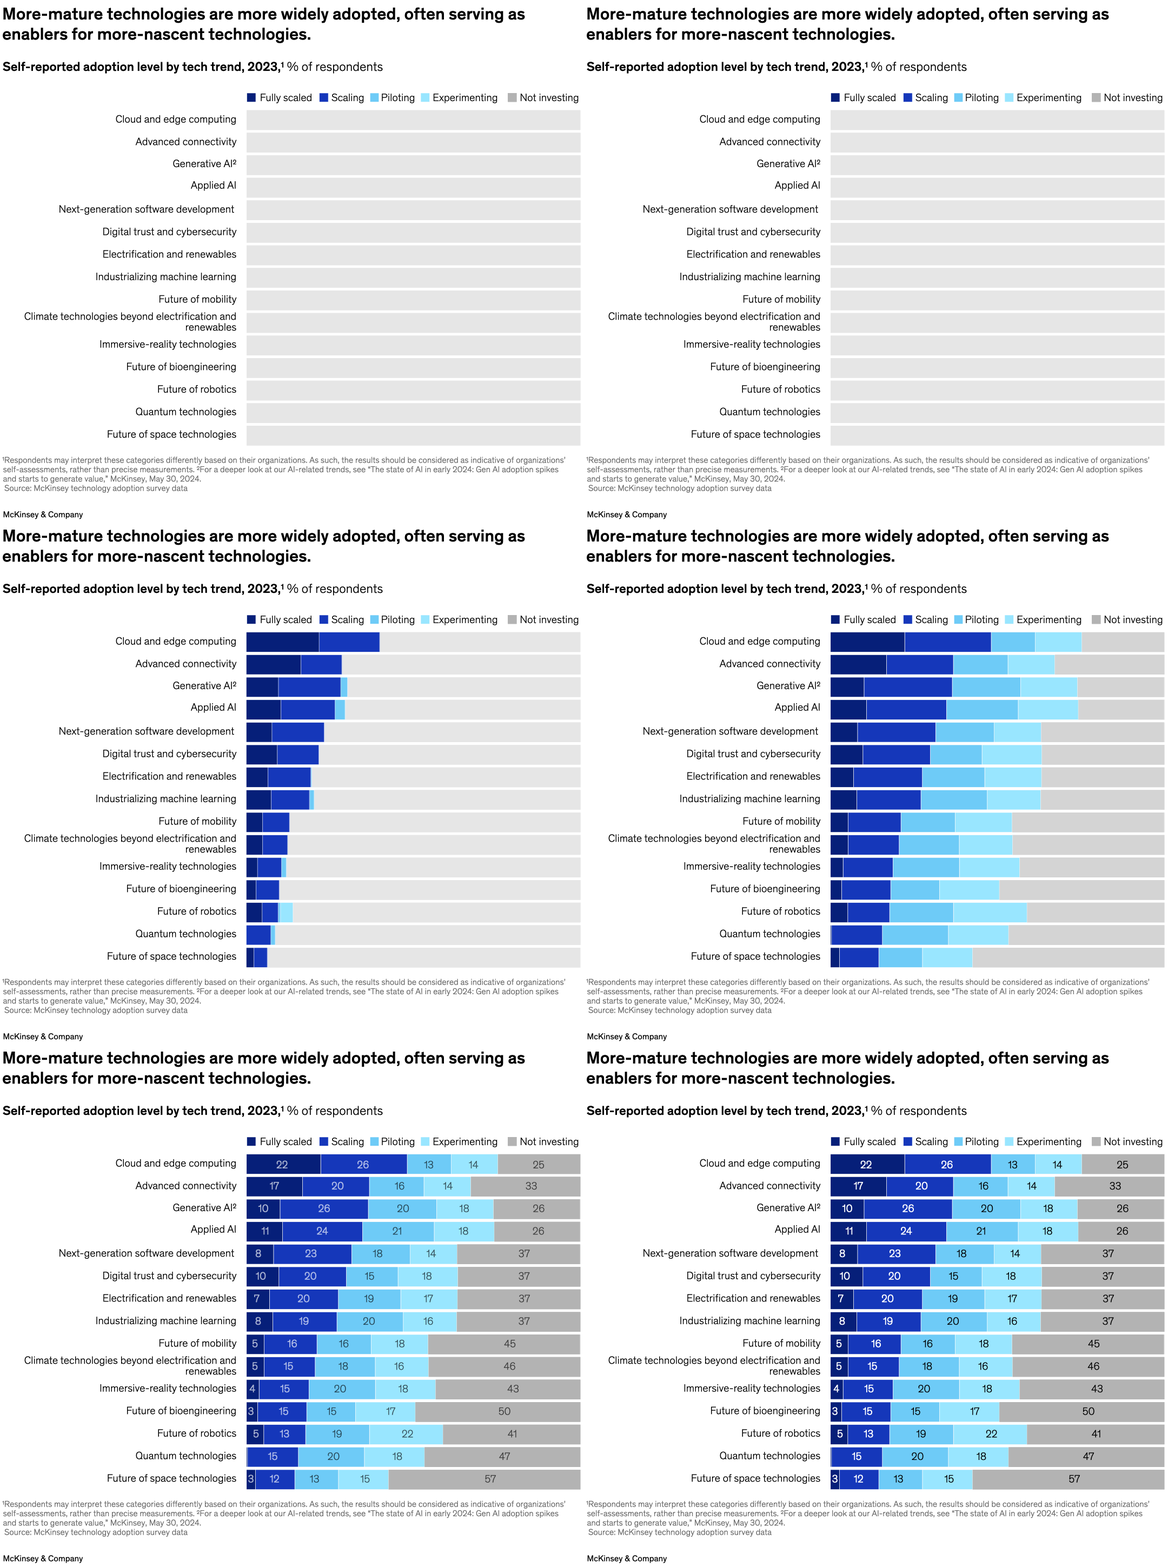
Enterprise technology often follows a path from innovation, to experimentation, to pilots, and, finally, to fully scaled adoption. Past the experimental phase, adoption picks up, and companies invest more in piloting and scaling. This progression is evident in trends such as next-generation software development and electrification, say McKinsey Global Institute partner Michael Chui and colleagues. Generative AI is a leader in terms of scaling among the 15 analyzed trends, while established technologies, such as cloud and edge computing and advanced connectivity, continue their quick adoption, which in turn facilitates emerging technologies.
To read the report, see “McKinsey Technology Trends Outlook 2024,” July 16, 2024.
customizer here
Visual form
Horizontal stacked bar chart.
Layout / body structure
The visual is a single ranked chart with one horizontal bar per technology trend, read from top to bottom, and a legend across the top showing the five adoption stages that stack inside every row.
What is being compared
It compares fifteen technology trends by how organizations place themselves along the adoption path from fully scaled through not investing.
Measurement system
Each row is measured as a percent of respondents, and the colored segments break that percentage into fully scaled, scaling, piloting, experimenting, and not investing.
Visible structure inside the graphic
Every trend row is divided into five colored segments, with the darker blue sections showing the most mature adoption, the lighter blue sections showing earlier testing stages, and the gray tail showing organizations that are not investing at all.
Main takeaway from the visual
The chart makes maturity differences easy to see: cloud and edge computing and advanced connectivity sit near the top with the strongest scaled and scaling shares, while bioengineering, space technologies, and several climate-adjacent trends remain much earlier and far more likely to be in the not-investing bucket.
Key standout values or extremes
Cloud and edge computing shows 22 percent fully scaled and 26 percent scaling, while advanced connectivity shows 17 percent fully scaled and 20 percent scaling; at the other end, future of space technologies has 57 percent not investing, future of bioengineering has 50 percent not investing, and climate technologies beyond electrification and renewables has 46 percent not investing.
Controls / sequence, when applicable
This is a static chart image with no in-chart controls to operate.
Companion media, when applicable
There is no separate companion audio or video; the chart image is the full visual on this page.