Source page: McKinsey & Company
Commentary
UK corporations keep things private
Corporate finance | UK
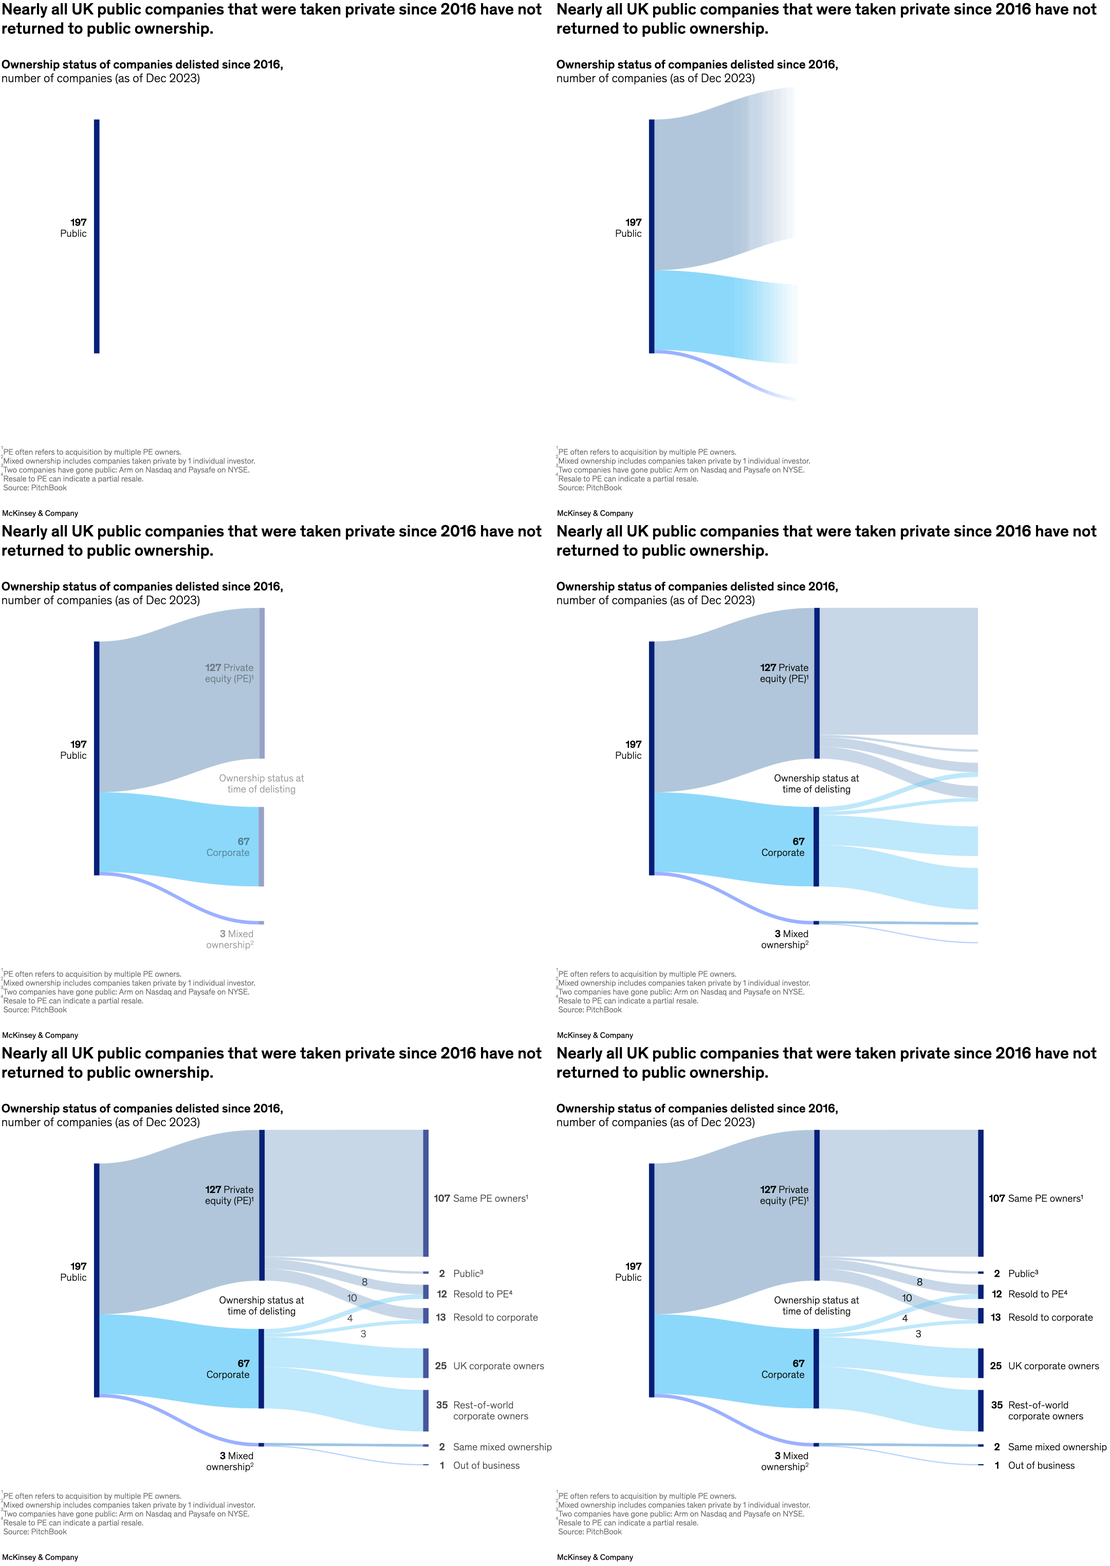
August 2, 2024 – The United Kingdom has attracted $1.8 trillion in private equity investments and $0.95 trillion in foreign direct investments in the past decade and a half. This influx helped shape the corporate landscape, as investors took publicly listed companies private or bought and invested in unlisted ones, senior partner Tunde Olanrewaju and colleagues explain. From 2016 to 2023, nearly 200 UK firms were delisted from the London Stock Exchange via private acquisitions, and only two have since returned to public listing.
To read the report, see “Aiming higher: Embedding ‘systematic ambition’ to drive UK corporate growth,” July 15, 2024.
customizer here
Visual form
Sankey-style ownership-flow diagram.
Layout / body structure
The visual reads from left to right across three ownership stages: the total pool of delisted public companies on the left, ownership status at the time of delisting in the middle, and the later ownership outcome on the right.
What is being compared
It compares where UK public companies delisted since 2016 ended up after going private, broken out by private-equity, corporate, and mixed-ownership paths.
Measurement system
The values are counts of companies as of December 2023, and ribbon width visually represents how many companies flow from one ownership bucket into the next.
Visible structure inside the graphic
A broad left-hand bar for 197 public companies splits into three middle buckets – 127 private equity, 67 corporate, and 3 mixed ownership – and those middle buckets then flow into narrower right-hand outcome labels such as same PE owners, resold to PE, resold to corporate, UK corporate owners, rest-of-world corporate owners, same mixed ownership, public, and out of business.
Main takeaway from the visual
The diagram makes the lock-in effect unmistakable: once these companies go private, almost none return to public ownership, and most of the flow stays inside private-equity or corporate ownership channels instead.
Key standout values or extremes
The single largest outcome is 107 companies remaining with the same PE owners, 35 end with rest-of-world corporate owners, 25 with UK corporate owners, and only 2 companies return to public ownership out of the entire group of 197 delisted companies.
Controls / sequence, when applicable
This is a static chart image with no in-chart controls to operate.
Companion media, when applicable
There is no separate companion audio or video; the chart image is the full visual on this page.